
 Yahoo Finance
 Here's How We Evaluate FBL Financial Group, Inc.'s (NYSE:FFG) Dividend

Today we'll take a closer look at FBL Financial Group, Inc. (NYSE:FFG) from a dividend investor's perspective. Owning a strong business and reinvesting the dividends is widely seen as an attractive way of growing your wealth. On the other hand, investors have been known to buy a stock because of its yield, and then lose money if the company's dividend doesn't live up to expectations.
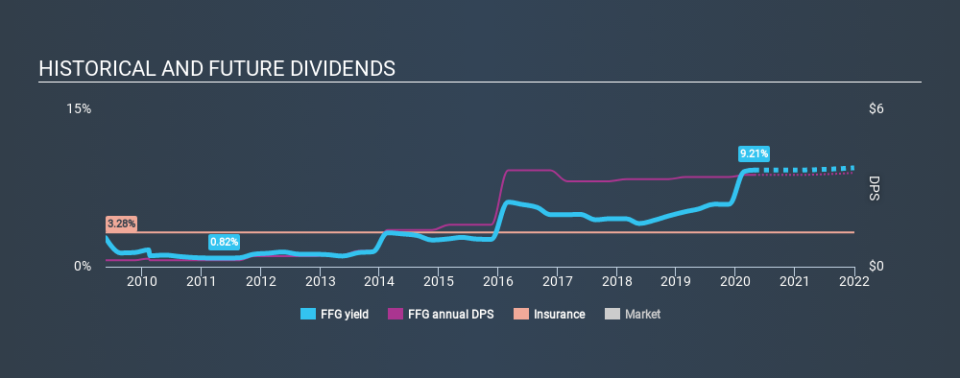
In this case, FBL Financial Group likely looks attractive to investors, given its 9.2% dividend yield and a payment history of over ten years. We'd guess that plenty of investors have purchased it for the income. The company also bought back stock equivalent to around 0.6% of market capitalisation this year. Remember that the recent share price drop will make FBL Financial Group's yield look higher, even though recent events might have impacted the company's prospects. When buying stocks for their dividends, you should always run through the checks below, to see if the dividend looks sustainable.
Click the interactive chart for our full dividend analysis
Payout ratios
Companies (usually) pay dividends out of their earnings. If a company is paying more than it earns, the dividend might have to be cut. As a result, we should always investigate whether a company can afford its dividend, measured as a percentage of a company's net income after tax. In the last year, FBL Financial Group paid out 38% of its profit as dividends. This is a medium payout level that leaves enough capital in the business to fund opportunities that might arise, while also rewarding shareholders. One of the risks is that management reinvests the retained capital poorly instead of paying a higher dividend.
Remember, you can always get a snapshot of FBL Financial Group's latest financial position, by checking our visualisation of its financial health.
Dividend Volatility
From the perspective of an income investor who wants to earn dividends for many years, there is not much point buying a stock if its dividend is regularly cut or is not reliable. For the purpose of this article, we only scrutinise the last decade of FBL Financial Group's dividend payments. The dividend has been cut on at least one occasion historically. During the past ten-year period, the first annual payment was US$0.25 in 2010, compared to US$3.50 last year. Dividends per share have grown at approximately 30% per year over this time. The growth in dividends has not been linear, but the CAGR is a decent approximation of the rate of change over this time frame.
It's not great to see that the payment has been cut in the past. We're generally more wary of companies that have cut their dividend before, as they tend to perform worse in an economic downturn.
Dividend Growth Potential
With a relatively unstable dividend, it's even more important to see if earnings per share (EPS) are growing. Why take the risk of a dividend getting cut, unless there's a good chance of bigger dividends in future? FBL Financial Group has grown its earnings per share at 2.9% per annum over the past five years. A payout ratio below 50% leaves ample room to reinvest in the business, and provides finanical flexibility. However, earnings per share are unfortunately not growing much. Might this suggest that the company should pay a higher dividend instead?
Conclusion
To summarise, shareholders should always check that FBL Financial Group's dividends are affordable, that its dividend payments are relatively stable, and that it has decent prospects for growing its earnings and dividend. We're glad to see FBL Financial Group has a low payout ratio, as this suggests earnings are being reinvested in the business. Unfortunately, earnings growth has also been mediocre, and the company has cut its dividend at least once in the past. While we're not hugely bearish on it, overall we think there are potentially better dividend stocks than FBL Financial Group out there.
It's important to note that companies having a consistent dividend policy will generate greater investor confidence than those having an erratic one. However, there are other things to consider for investors when analysing stock performance. Just as an example, we've come accross 3 warning signs for FBL Financial Group you should be aware of, and 1 of them makes us a bit uncomfortable.
We have also put together a list of global stocks with a market capitalisation above $1bn and yielding more 3%.
If you spot an error that warrants correction, please contact the editor at editorial-team@simplywallst.com. This article by Simply Wall St is general in nature. It does not constitute a recommendation to buy or sell any stock, and does not take account of your objectives, or your financial situation. Simply Wall St has no position in the stocks mentioned.
We aim to bring you long-term focused research analysis driven by fundamental data. Note that our analysis may not factor in the latest price-sensitive company announcements or qualitative material. Thank you for reading.
