
 Yahoo Finance
 Here's What Galliford Try plc's (LON:GFRD) P/E Ratio Is Telling Us

Today, we'll introduce the concept of the P/E ratio for those who are learning about investing. We'll look at Galliford Try plc's (LON:GFRD) P/E ratio and reflect on what it tells us about the company's share price. Galliford Try has a price to earnings ratio of 5.37, based on the last twelve months. That is equivalent to an earnings yield of about 19%.
Want to participate in a short research study? Help shape the future of investing tools and you could win a $250 gift card!
Check out our latest analysis for Galliford Try
How Do You Calculate A P/E Ratio?
The formula for P/E is:
Price to Earnings Ratio = Share Price ÷ Earnings per Share (EPS)
Or for Galliford Try:
P/E of 5.37 = £5.55 ÷ £1.03 (Based on the year to December 2018.)
Is A High P/E Ratio Good?
The higher the P/E ratio, the higher the price tag of a business, relative to its trailing earnings. All else being equal, it's better to pay a low price -- but as Warren Buffett said, 'It's far better to buy a wonderful company at a fair price than a fair company at a wonderful price.'
How Growth Rates Impact P/E Ratios
If earnings fall then in the future the 'E' will be lower. That means even if the current P/E is low, it will increase over time if the share price stays flat. So while a stock may look cheap based on past earnings, it could be expensive based on future earnings.
Galliford Try's 93% EPS improvement over the last year was like bamboo growth after rain; rapid and impressive. On the other hand, the longer term performance is poor, with EPS down -6.0% per year over 3 years.
Does Galliford Try Have A Relatively High Or Low P/E For Its Industry?
We can get an indication of market expectations by looking at the P/E ratio. If you look at the image below, you can see Galliford Try has a lower P/E than the average (9.8) in the construction industry classification.
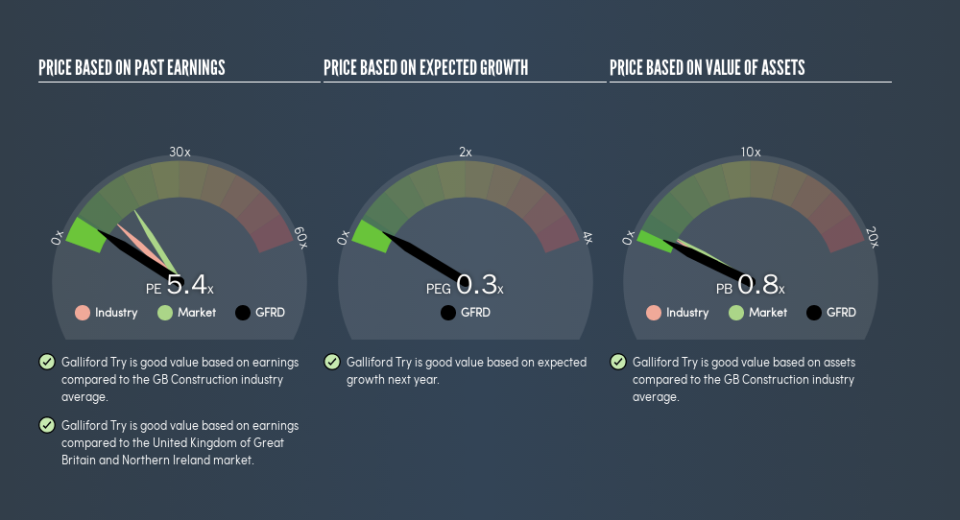
Its relatively low P/E ratio indicates that Galliford Try shareholders think it will struggle to do as well as other companies in its industry classification. While current expectations are low, the stock could be undervalued if the situation is better than the market assumes. You should delve deeper. I like to check if company insiders have been buying or selling.
Don't Forget: The P/E Does Not Account For Debt or Bank Deposits
It's important to note that the P/E ratio considers the market capitalization, not the enterprise value. That means it doesn't take debt or cash into account. Theoretically, a business can improve its earnings (and produce a lower P/E in the future) by investing in growth. That means taking on debt (or spending its cash).
Such spending might be good or bad, overall, but the key point here is that you need to look at debt to understand the P/E ratio in context.
Is Debt Impacting Galliford Try's P/E?
Galliford Try's net debt is 6.7% of its market cap. It would probably trade on a higher P/E ratio if it had a lot of cash, but I doubt it is having a big impact.
The Verdict On Galliford Try's P/E Ratio
Galliford Try trades on a P/E ratio of 5.4, which is below the GB market average of 16.3. The EPS growth last year was strong, and debt levels are quite reasonable. If it continues to grow, then the current low P/E may prove to be unjustified. Because analysts are predicting more growth in the future, one might have expected to see a higher P/E ratio. You can taker closer look at the fundamentals, here.
Investors should be looking to buy stocks that the market is wrong about. If it is underestimating a company, investors can make money by buying and holding the shares until the market corrects itself. So this free visualization of the analyst consensus on future earnings could help you make the right decision about whether to buy, sell, or hold.
Of course, you might find a fantastic investment by looking at a few good candidates. So take a peek at this free list of companies with modest (or no) debt, trading on a P/E below 20.
We aim to bring you long-term focused research analysis driven by fundamental data. Note that our analysis may not factor in the latest price-sensitive company announcements or qualitative material.
If you spot an error that warrants correction, please contact the editor at editorial-team@simplywallst.com. This article by Simply Wall St is general in nature. It does not constitute a recommendation to buy or sell any stock, and does not take account of your objectives, or your financial situation. Simply Wall St has no position in the stocks mentioned. Thank you for reading.
