
 Yahoo Finance
 Here's What Graphic Packaging Holding Company's (NYSE:GPK) P/E Is Telling Us

Today, we'll introduce the concept of the P/E ratio for those who are learning about investing. We'll apply a basic P/E ratio analysis to Graphic Packaging Holding Company's (NYSE:GPK), to help you decide if the stock is worth further research. What is Graphic Packaging Holding's P/E ratio? Well, based on the last twelve months it is 22.12. That is equivalent to an earnings yield of about 4.5%.
Check out our latest analysis for Graphic Packaging Holding
How Do You Calculate A P/E Ratio?
The formula for price to earnings is:
Price to Earnings Ratio = Share Price ÷ Earnings per Share (EPS)
Or for Graphic Packaging Holding:
P/E of 22.12 = USD16.43 ÷ USD0.74 (Based on the trailing twelve months to September 2019.)
Is A High Price-to-Earnings Ratio Good?
The higher the P/E ratio, the higher the price tag of a business, relative to its trailing earnings. That isn't a good or a bad thing on its own, but a high P/E means that buyers have a higher opinion of the business's prospects, relative to stocks with a lower P/E.
Does Graphic Packaging Holding Have A Relatively High Or Low P/E For Its Industry?
The P/E ratio indicates whether the market has higher or lower expectations of a company. You can see in the image below that the average P/E (18.5) for companies in the packaging industry is lower than Graphic Packaging Holding's P/E.
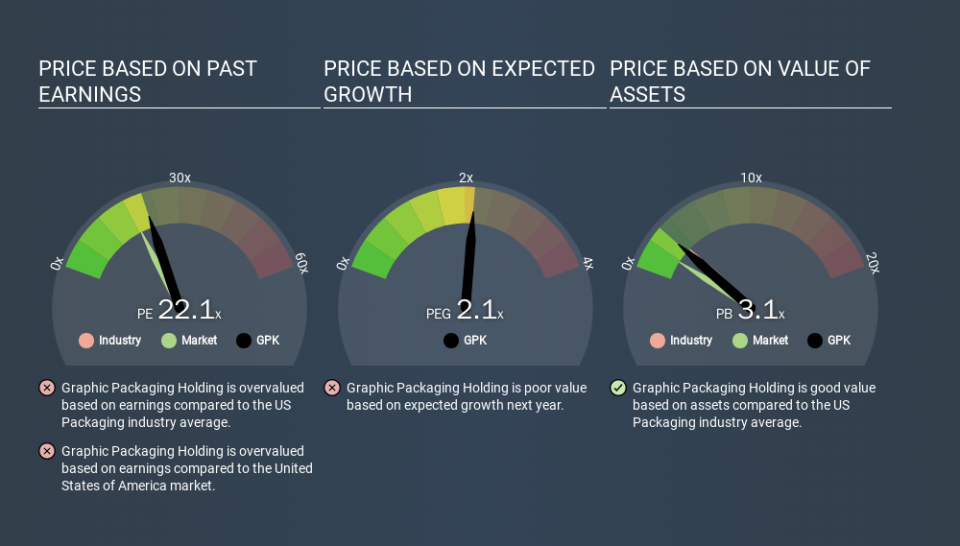
That means that the market expects Graphic Packaging Holding will outperform other companies in its industry. Clearly the market expects growth, but it isn't guaranteed. So further research is always essential. I often monitor director buying and selling.
How Growth Rates Impact P/E Ratios
Companies that shrink earnings per share quickly will rapidly decrease the 'E' in the equation. Therefore, even if you pay a low multiple of earnings now, that multiple will become higher in the future. A higher P/E should indicate the stock is expensive relative to others -- and that may encourage shareholders to sell.
Graphic Packaging Holding's earnings per share fell by 34% in the last twelve months. But it has grown its earnings per share by 21% per year over the last five years. And EPS is down 1.3% a year, over the last 3 years. This growth rate might warrant a low P/E ratio.
Remember: P/E Ratios Don't Consider The Balance Sheet
One drawback of using a P/E ratio is that it considers market capitalization, but not the balance sheet. In other words, it does not consider any debt or cash that the company may have on the balance sheet. Theoretically, a business can improve its earnings (and produce a lower P/E in the future) by investing in growth. That means taking on debt (or spending its cash).
Such spending might be good or bad, overall, but the key point here is that you need to look at debt to understand the P/E ratio in context.
So What Does Graphic Packaging Holding's Balance Sheet Tell Us?
Graphic Packaging Holding has net debt worth 59% of its market capitalization. If you want to compare its P/E ratio to other companies, you should absolutely keep in mind it has significant borrowings.
The Verdict On Graphic Packaging Holding's P/E Ratio
Graphic Packaging Holding trades on a P/E ratio of 22.1, which is above its market average of 18.6. With significant debt and no EPS growth last year, shareholders are betting on an improvement in earnings from the company.
Investors have an opportunity when market expectations about a stock are wrong. As value investor Benjamin Graham famously said, 'In the short run, the market is a voting machine but in the long run, it is a weighing machine. So this free report on the analyst consensus forecasts could help you make a master move on this stock.
Of course you might be able to find a better stock than Graphic Packaging Holding. So you may wish to see this free collection of other companies that have grown earnings strongly.
If you spot an error that warrants correction, please contact the editor at editorial-team@simplywallst.com. This article by Simply Wall St is general in nature. It does not constitute a recommendation to buy or sell any stock, and does not take account of your objectives, or your financial situation. Simply Wall St has no position in the stocks mentioned.
We aim to bring you long-term focused research analysis driven by fundamental data. Note that our analysis may not factor in the latest price-sensitive company announcements or qualitative material. Thank you for reading.
