
 Yahoo Finance
 Here's What Industria de Diseño Textil, S.A.'s (BME:ITX) P/E Is Telling Us

Want to participate in a short research study? Help shape the future of investing tools and you could win a $250 gift card!
This article is for investors who would like to improve their understanding of price to earnings ratios (P/E ratios). To keep it practical, we'll show how Industria de Diseño Textil, S.A.'s (BME:ITX) P/E ratio could help you assess the value on offer. Industria de Diseño Textil has a price to earnings ratio of 23.46, based on the last twelve months. That means that at current prices, buyers pay €23.46 for every €1 in trailing yearly profits.
View our latest analysis for Industria de Diseño Textil
How Do I Calculate Industria de Diseño Textil's Price To Earnings Ratio?
The formula for price to earnings is:
Price to Earnings Ratio = Share Price ÷ Earnings per Share (EPS)
Or for Industria de Diseño Textil:
P/E of 23.46 = €26.45 ÷ €1.13 (Based on the year to April 2019.)
Is A High Price-to-Earnings Ratio Good?
A higher P/E ratio means that investors are paying a higher price for each €1 of company earnings. That is not a good or a bad thing per se, but a high P/E does imply buyers are optimistic about the future.
How Growth Rates Impact P/E Ratios
Earnings growth rates have a big influence on P/E ratios. If earnings are growing quickly, then the 'E' in the equation will increase faster than it would otherwise. That means unless the share price increases, the P/E will reduce in a few years. A lower P/E should indicate the stock is cheap relative to others -- and that may attract buyers.
Industria de Diseño Textil increased earnings per share by 3.8% last year. And it has bolstered its earnings per share by 8.4% per year over the last five years.
Does Industria de Diseño Textil Have A Relatively High Or Low P/E For Its Industry?
One good way to get a quick read on what market participants expect of a company is to look at its P/E ratio. You can see in the image below that the average P/E (14.6) for companies in the specialty retail industry is lower than Industria de Diseño Textil's P/E.
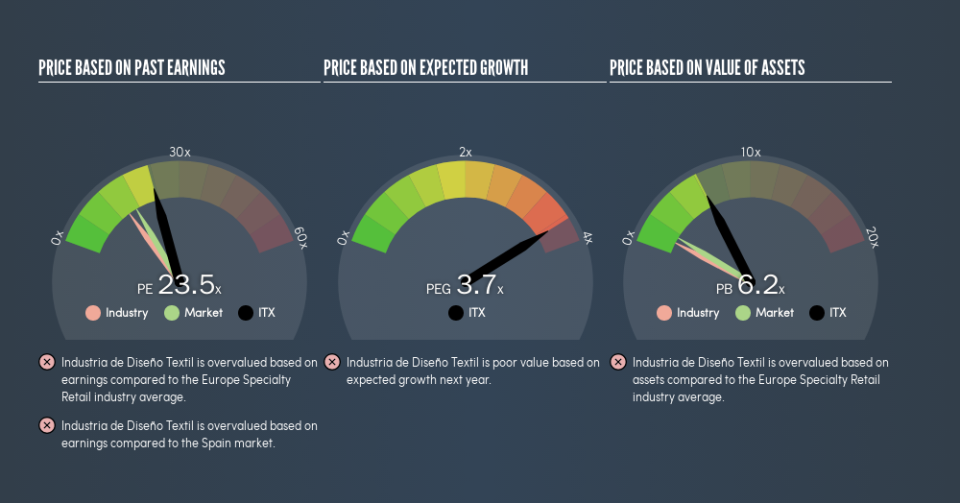
That means that the market expects Industria de Diseño Textil will outperform other companies in its industry. Shareholders are clearly optimistic, but the future is always uncertain. So further research is always essential. I often monitor director buying and selling.
Remember: P/E Ratios Don't Consider The Balance Sheet
The 'Price' in P/E reflects the market capitalization of the company. So it won't reflect the advantage of cash, or disadvantage of debt. Hypothetically, a company could reduce its future P/E ratio by spending its cash (or taking on debt) to achieve higher earnings.
While growth expenditure doesn't always pay off, the point is that it is a good option to have; but one that the P/E ratio ignores.
How Does Industria de Diseño Textil's Debt Impact Its P/E Ratio?
The extra options and safety that comes with Industria de Diseño Textil's €6.7b net cash position means that it deserves a higher P/E than it would if it had a lot of net debt.
The Verdict On Industria de Diseño Textil's P/E Ratio
Industria de Diseño Textil has a P/E of 23.5. That's higher than the average in the ES market, which is 17. EPS was up modestly better over the last twelve months. And the healthy balance sheet means the company can sustain growth while the P/E suggests shareholders think it will.
Investors should be looking to buy stocks that the market is wrong about. As value investor Benjamin Graham famously said, 'In the short run, the market is a voting machine but in the long run, it is a weighing machine.' So this free visualization of the analyst consensus on future earnings could help you make the right decision about whether to buy, sell, or hold.
You might be able to find a better buy than Industria de Diseño Textil. If you want a selection of possible winners, check out this free list of interesting companies that trade on a P/E below 20 (but have proven they can grow earnings).
We aim to bring you long-term focused research analysis driven by fundamental data. Note that our analysis may not factor in the latest price-sensitive company announcements or qualitative material.
If you spot an error that warrants correction, please contact the editor at editorial-team@simplywallst.com. This article by Simply Wall St is general in nature. It does not constitute a recommendation to buy or sell any stock, and does not take account of your objectives, or your financial situation. Simply Wall St has no position in the stocks mentioned. Thank you for reading.
