
 Yahoo Finance
 Here's What ITV plc's (LON:ITV) P/E Ratio Is Telling Us

The goal of this article is to teach you how to use price to earnings ratios (P/E ratios). We'll show how you can use ITV plc's (LON:ITV) P/E ratio to inform your assessment of the investment opportunity. ITV has a P/E ratio of 12.15, based on the last twelve months. That means that at current prices, buyers pay £12.15 for every £1 in trailing yearly profits.
See our latest analysis for ITV
How Do You Calculate A P/E Ratio?
The formula for price to earnings is:
Price to Earnings Ratio = Share Price ÷ Earnings per Share (EPS)
Or for ITV:
P/E of 12.15 = £1.35 ÷ £0.11 (Based on the year to June 2019.)
Is A High Price-to-Earnings Ratio Good?
The higher the P/E ratio, the higher the price tag of a business, relative to its trailing earnings. That is not a good or a bad thing per se, but a high P/E does imply buyers are optimistic about the future.
Does ITV Have A Relatively High Or Low P/E For Its Industry?
We can get an indication of market expectations by looking at the P/E ratio. The image below shows that ITV has a lower P/E than the average (19.6) P/E for companies in the media industry.
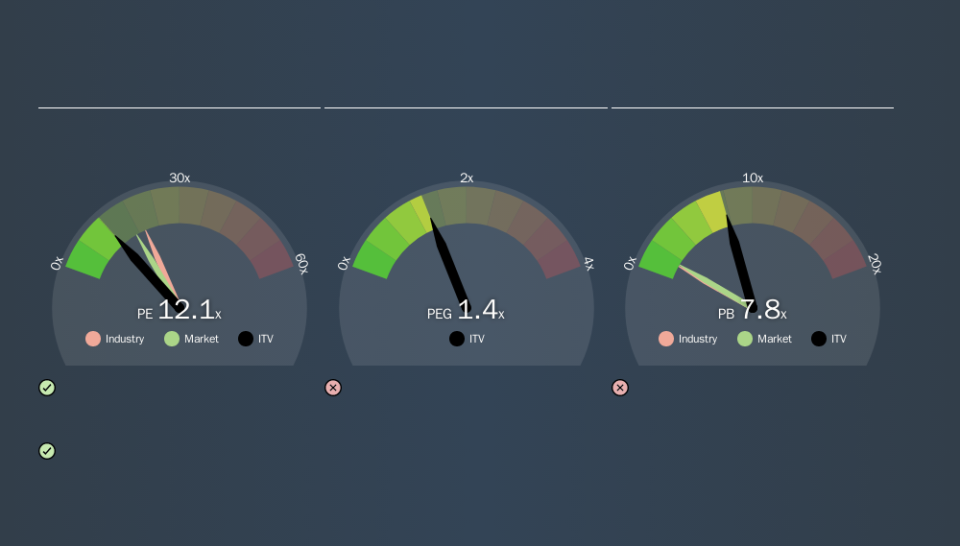
This suggests that market participants think ITV will underperform other companies in its industry. Since the market seems unimpressed with ITV, it's quite possible it could surprise on the upside. It is arguably worth checking if insiders are buying shares, because that might imply they believe the stock is undervalued.
How Growth Rates Impact P/E Ratios
Companies that shrink earnings per share quickly will rapidly decrease the 'E' in the equation. That means even if the current P/E is low, it will increase over time if the share price stays flat. Then, a higher P/E might scare off shareholders, pushing the share price down.
ITV increased earnings per share by 6.5% last year. And earnings per share have improved by 2.7% annually, over the last five years. In contrast, EPS has decreased by 2.7%, annually, over 3 years.
Don't Forget: The P/E Does Not Account For Debt or Bank Deposits
It's important to note that the P/E ratio considers the market capitalization, not the enterprise value. So it won't reflect the advantage of cash, or disadvantage of debt. In theory, a company can lower its future P/E ratio by using cash or debt to invest in growth.
Such expenditure might be good or bad, in the long term, but the point here is that the balance sheet is not reflected by this ratio.
Is Debt Impacting ITV's P/E?
ITV's net debt is 20% of its market cap. It would probably deserve a higher P/E ratio if it was net cash, since it would have more options for growth.
The Verdict On ITV's P/E Ratio
ITV's P/E is 12.1 which is below average (16.9) in the GB market. The company hasn't stretched its balance sheet, and earnings are improving. If you believe growth will continue - or even increase - then the low P/E may signify opportunity.
Investors should be looking to buy stocks that the market is wrong about. If it is underestimating a company, investors can make money by buying and holding the shares until the market corrects itself. So this free report on the analyst consensus forecasts could help you make a master move on this stock.
But note: ITV may not be the best stock to buy. So take a peek at this free list of interesting companies with strong recent earnings growth (and a P/E ratio below 20).
We aim to bring you long-term focused research analysis driven by fundamental data. Note that our analysis may not factor in the latest price-sensitive company announcements or qualitative material.
If you spot an error that warrants correction, please contact the editor at editorial-team@simplywallst.com. This article by Simply Wall St is general in nature. It does not constitute a recommendation to buy or sell any stock, and does not take account of your objectives, or your financial situation. Simply Wall St has no position in the stocks mentioned. Thank you for reading.
