
 Yahoo Finance
 Here's How P/E Ratios Can Help Us Understand Infineon Technologies AG (ETR:IFX)
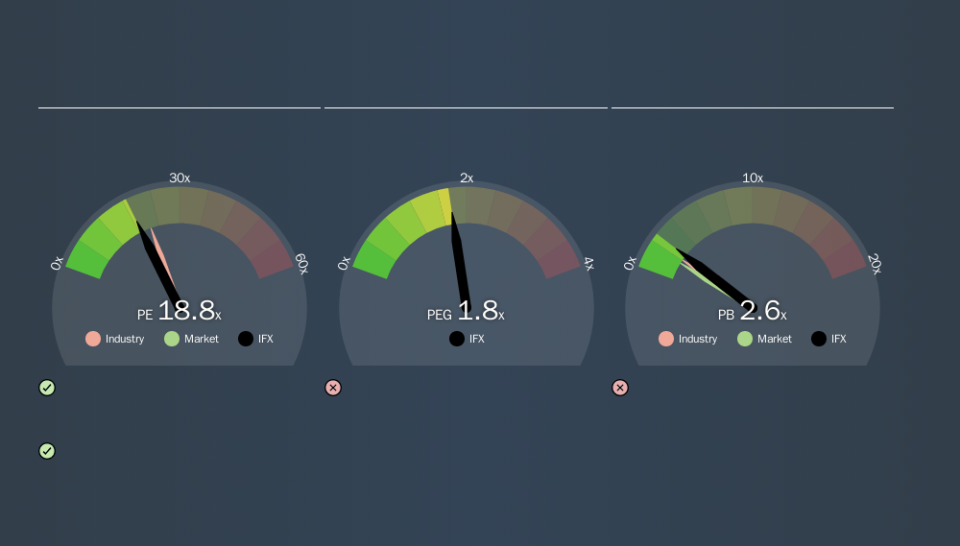
This article is written for those who want to get better at using price to earnings ratios (P/E ratios). We'll show how you can use Infineon Technologies AG's (ETR:IFX) P/E ratio to inform your assessment of the investment opportunity. Infineon Technologies has a P/E ratio of 18.76, based on the last twelve months. In other words, at today's prices, investors are paying €18.76 for every €1 in prior year profit.
See our latest analysis for Infineon Technologies
How Do I Calculate Infineon Technologies's Price To Earnings Ratio?
The formula for price to earnings is:
Price to Earnings Ratio = Price per Share ÷ Earnings per Share (EPS)
Or for Infineon Technologies:
P/E of 18.76 = €16.97 ÷ €0.90 (Based on the year to June 2019.)
Is A High P/E Ratio Good?
A higher P/E ratio means that buyers have to pay a higher price for each €1 the company has earned over the last year. That isn't necessarily good or bad, but a high P/E implies relatively high expectations of what a company can achieve in the future.
Does Infineon Technologies Have A Relatively High Or Low P/E For Its Industry?
One good way to get a quick read on what market participants expect of a company is to look at its P/E ratio. If you look at the image below, you can see Infineon Technologies has a lower P/E than the average (21.5) in the semiconductor industry classification.
This suggests that market participants think Infineon Technologies will underperform other companies in its industry. While current expectations are low, the stock could be undervalued if the situation is better than the market assumes. You should delve deeper. I like to check if company insiders have been buying or selling.
How Growth Rates Impact P/E Ratios
Generally speaking the rate of earnings growth has a profound impact on a company's P/E multiple. That's because companies that grow earnings per share quickly will rapidly increase the 'E' in the equation. Therefore, even if you pay a high multiple of earnings now, that multiple will become lower in the future. A lower P/E should indicate the stock is cheap relative to others -- and that may attract buyers.
Infineon Technologies saw earnings per share decrease by 6.6% last year. But EPS is up 16% over the last 5 years.
Don't Forget: The P/E Does Not Account For Debt or Bank Deposits
Don't forget that the P/E ratio considers market capitalization. Thus, the metric does not reflect cash or debt held by the company. Theoretically, a business can improve its earnings (and produce a lower P/E in the future) by investing in growth. That means taking on debt (or spending its cash).
Spending on growth might be good or bad a few years later, but the point is that the P/E ratio does not account for the option (or lack thereof).
Infineon Technologies's Balance Sheet
The extra options and safety that comes with Infineon Technologies's €1.9b net cash position means that it deserves a higher P/E than it would if it had a lot of net debt.
The Verdict On Infineon Technologies's P/E Ratio
Infineon Technologies trades on a P/E ratio of 18.8, which is fairly close to the DE market average of 18.8. While the absence of growth in the last year is probably causing a degree of pessimism, the healthy balance sheet means the company retains potential for future growth. So it's not surprising to see it trade on a P/E roughly in line with the market.
Investors have an opportunity when market expectations about a stock are wrong. If the reality for a company is not as bad as the P/E ratio indicates, then the share price should increase as the market realizes this. So this free visualization of the analyst consensus on future earnings could help you make the right decision about whether to buy, sell, or hold.
Of course you might be able to find a better stock than Infineon Technologies. So you may wish to see this free collection of other companies that have grown earnings strongly.
We aim to bring you long-term focused research analysis driven by fundamental data. Note that our analysis may not factor in the latest price-sensitive company announcements or qualitative material.
If you spot an error that warrants correction, please contact the editor at editorial-team@simplywallst.com. This article by Simply Wall St is general in nature. It does not constitute a recommendation to buy or sell any stock, and does not take account of your objectives, or your financial situation. Simply Wall St has no position in the stocks mentioned. Thank you for reading.
