
 Yahoo Finance
 Here's How P/E Ratios Can Help Us Understand Kindred Group plc (STO:KIND SDB)

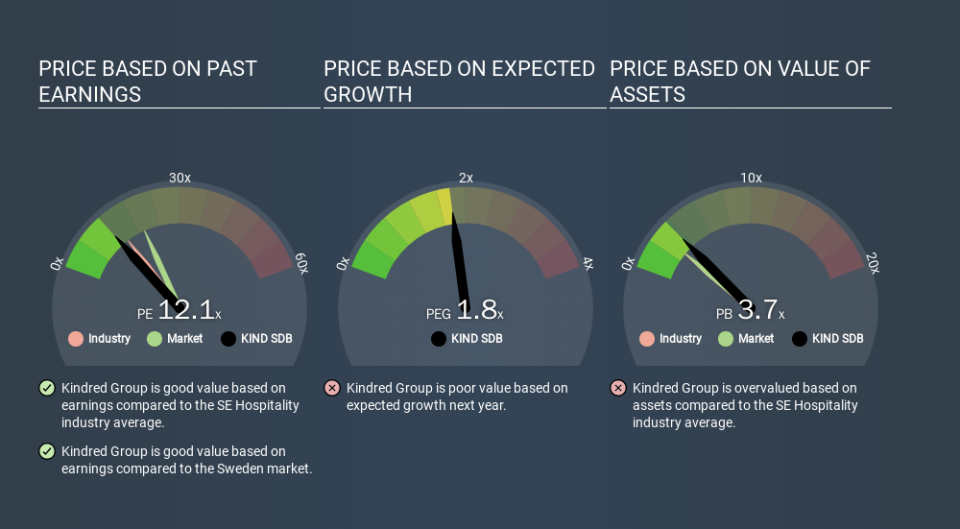
This article is written for those who want to get better at using price to earnings ratios (P/E ratios). We'll look at Kindred Group plc's (STO:KIND SDB) P/E ratio and reflect on what it tells us about the company's share price. Looking at earnings over the last twelve months, Kindred Group has a P/E ratio of 12.11. That corresponds to an earnings yield of approximately 8.3%.
Check out our latest analysis for Kindred Group
How Do I Calculate Kindred Group's Price To Earnings Ratio?
The formula for P/E is:
Price to Earnings Ratio = Share Price (in reporting currency) ÷ Earnings per Share (EPS)
Or for Kindred Group:
P/E of 12.11 = SEK4.54 (Note: this is the share price in the reporting currency, namely, GBP ) ÷ SEK0.38 (Based on the year to September 2019.)
Is A High P/E Ratio Good?
A higher P/E ratio means that buyers have to pay a higher price for each SEK1 the company has earned over the last year. That isn't a good or a bad thing on its own, but a high P/E means that buyers have a higher opinion of the business's prospects, relative to stocks with a lower P/E.
Does Kindred Group Have A Relatively High Or Low P/E For Its Industry?
We can get an indication of market expectations by looking at the P/E ratio. If you look at the image below, you can see Kindred Group has a lower P/E than the average (14.1) in the hospitality industry classification.
Its relatively low P/E ratio indicates that Kindred Group shareholders think it will struggle to do as well as other companies in its industry classification. Since the market seems unimpressed with Kindred Group, it's quite possible it could surprise on the upside. You should delve deeper. I like to check if company insiders have been buying or selling.
How Growth Rates Impact P/E Ratios
Generally speaking the rate of earnings growth has a profound impact on a company's P/E multiple. Earnings growth means that in the future the 'E' will be higher. That means even if the current P/E is high, it will reduce over time if the share price stays flat. A lower P/E should indicate the stock is cheap relative to others -- and that may attract buyers.
Kindred Group saw earnings per share decrease by 40% last year. But EPS is up 5.2% over the last 3 years. And over the longer term (5 years) earnings per share have decreased 2.3% annually. This could justify a pessimistic P/E.
Don't Forget: The P/E Does Not Account For Debt or Bank Deposits
The 'Price' in P/E reflects the market capitalization of the company. In other words, it does not consider any debt or cash that the company may have on the balance sheet. Hypothetically, a company could reduce its future P/E ratio by spending its cash (or taking on debt) to achieve higher earnings.
Such expenditure might be good or bad, in the long term, but the point here is that the balance sheet is not reflected by this ratio.
So What Does Kindred Group's Balance Sheet Tell Us?
Kindred Group's net debt is 5.9% of its market cap. The market might award it a higher P/E ratio if it had net cash, but its unlikely this low level of net borrowing is having a big impact on the P/E multiple.
The Bottom Line On Kindred Group's P/E Ratio
Kindred Group trades on a P/E ratio of 12.1, which is below the SE market average of 19.6. The debt levels are not a major concern, but the lack of EPS growth is likely weighing on sentiment.
Investors have an opportunity when market expectations about a stock are wrong. If the reality for a company is not as bad as the P/E ratio indicates, then the share price should increase as the market realizes this. So this free visualization of the analyst consensus on future earnings could help you make the right decision about whether to buy, sell, or hold.
Of course, you might find a fantastic investment by looking at a few good candidates. So take a peek at this free list of companies with modest (or no) debt, trading on a P/E below 20.
If you spot an error that warrants correction, please contact the editor at editorial-team@simplywallst.com. This article by Simply Wall St is general in nature. It does not constitute a recommendation to buy or sell any stock, and does not take account of your objectives, or your financial situation. Simply Wall St has no position in the stocks mentioned.
We aim to bring you long-term focused research analysis driven by fundamental data. Note that our analysis may not factor in the latest price-sensitive company announcements or qualitative material. Thank you for reading.
