
 Yahoo Finance
 Here's How P/E Ratios Can Help Us Understand IG Group Holdings plc (LON:IGG)

This article is for investors who would like to improve their understanding of price to earnings ratios (P/E ratios). We'll apply a basic P/E ratio analysis to IG Group Holdings plc's (LON:IGG), to help you decide if the stock is worth further research. IG Group Holdings has a price to earnings ratio of 15.93, based on the last twelve months. That means that at current prices, buyers pay £15.93 for every £1 in trailing yearly profits.
See our latest analysis for IG Group Holdings
How Do You Calculate A P/E Ratio?
The formula for P/E is:
Price to Earnings Ratio = Price per Share ÷ Earnings per Share (EPS)
Or for IG Group Holdings:
P/E of 15.93 = £6.86 ÷ £0.43 (Based on the year to May 2019.)
Is A High Price-to-Earnings Ratio Good?
The higher the P/E ratio, the higher the price tag of a business, relative to its trailing earnings. That isn't necessarily good or bad, but a high P/E implies relatively high expectations of what a company can achieve in the future.
Does IG Group Holdings Have A Relatively High Or Low P/E For Its Industry?
We can get an indication of market expectations by looking at the P/E ratio. If you look at the image below, you can see IG Group Holdings has a lower P/E than the average (21.1) in the capital markets industry classification.
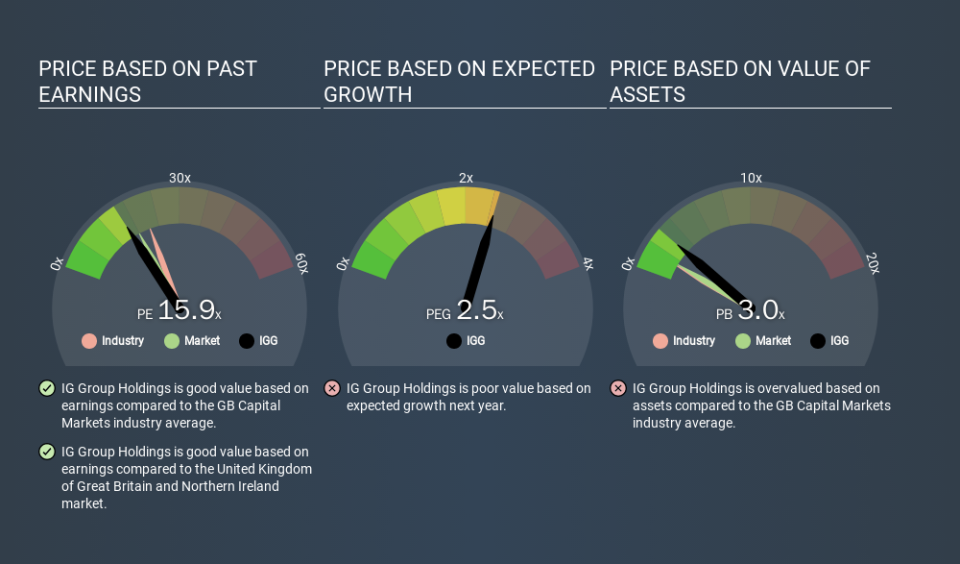
Its relatively low P/E ratio indicates that IG Group Holdings shareholders think it will struggle to do as well as other companies in its industry classification. Many investors like to buy stocks when the market is pessimistic about their prospects. If you consider the stock interesting, further research is recommended. For example, I often monitor director buying and selling.
How Growth Rates Impact P/E Ratios
If earnings fall then in the future the 'E' will be lower. That means even if the current P/E is low, it will increase over time if the share price stays flat. So while a stock may look cheap based on past earnings, it could be expensive based on future earnings.
IG Group Holdings shrunk earnings per share by 30% over the last year. But EPS is up 1.3% over the last 5 years. And over the longer term (3 years) earnings per share have decreased 1.4% annually. This could justify a low P/E.
A Limitation: P/E Ratios Ignore Debt and Cash In The Bank
It's important to note that the P/E ratio considers the market capitalization, not the enterprise value. So it won't reflect the advantage of cash, or disadvantage of debt. The exact same company would hypothetically deserve a higher P/E ratio if it had a strong balance sheet, than if it had a weak one with lots of debt, because a cashed up company can spend on growth.
While growth expenditure doesn't always pay off, the point is that it is a good option to have; but one that the P/E ratio ignores.
How Does IG Group Holdings's Debt Impact Its P/E Ratio?
With net cash of UK£274m, IG Group Holdings has a very strong balance sheet, which may be important for its business. Having said that, at 11% of its market capitalization the cash hoard would contribute towards a higher P/E ratio.
The Bottom Line On IG Group Holdings's P/E Ratio
IG Group Holdings trades on a P/E ratio of 15.9, which is below the GB market average of 17.8. Falling earnings per share are likely to be keeping potential buyers away, the healthy balance sheet means the company retains potential for future growth. If that occurs, the current low P/E could prove to be temporary.
Investors should be looking to buy stocks that the market is wrong about. If it is underestimating a company, investors can make money by buying and holding the shares until the market corrects itself. So this free report on the analyst consensus forecasts could help you make a master move on this stock.
Of course, you might find a fantastic investment by looking at a few good candidates. So take a peek at this free list of companies with modest (or no) debt, trading on a P/E below 20.
If you spot an error that warrants correction, please contact the editor at editorial-team@simplywallst.com. This article by Simply Wall St is general in nature. It does not constitute a recommendation to buy or sell any stock, and does not take account of your objectives, or your financial situation. Simply Wall St has no position in the stocks mentioned.
We aim to bring you long-term focused research analysis driven by fundamental data. Note that our analysis may not factor in the latest price-sensitive company announcements or qualitative material. Thank you for reading.
