
 Yahoo Finance
 Here's How P/E Ratios Can Help Us Understand Danaher Corporation (NYSE:DHR)

The goal of this article is to teach you how to use price to earnings ratios (P/E ratios). We'll apply a basic P/E ratio analysis to Danaher Corporation's (NYSE:DHR), to help you decide if the stock is worth further research. Looking at earnings over the last twelve months, Danaher has a P/E ratio of 37.24. That corresponds to an earnings yield of approximately 2.7%.
Check out our latest analysis for Danaher
How Do You Calculate Danaher's P/E Ratio?
The formula for P/E is:
Price to Earnings Ratio = Price per Share ÷ Earnings per Share (EPS)
Or for Danaher:
P/E of 37.24 = $127.78 ÷ $3.43 (Based on the trailing twelve months to March 2019.)
Is A High Price-to-Earnings Ratio Good?
A higher P/E ratio implies that investors pay a higher price for the earning power of the business. That isn't a good or a bad thing on its own, but a high P/E means that buyers have a higher opinion of the business's prospects, relative to stocks with a lower P/E.
How Growth Rates Impact P/E Ratios
P/E ratios primarily reflect market expectations around earnings growth rates. When earnings grow, the 'E' increases, over time. That means unless the share price increases, the P/E will reduce in a few years. A lower P/E should indicate the stock is cheap relative to others -- and that may attract buyers.
Danaher shrunk earnings per share by 6.3% last year. But over the longer term (3 years), earnings per share have increased by 10%. And it has shrunk its earnings per share by 1.5% per year over the last five years. So it would be surprising to see a high P/E.
Does Danaher Have A Relatively High Or Low P/E For Its Industry?
The P/E ratio essentially measures market expectations of a company. The image below shows that Danaher has a P/E ratio that is roughly in line with the medical equipment industry average (39.6).
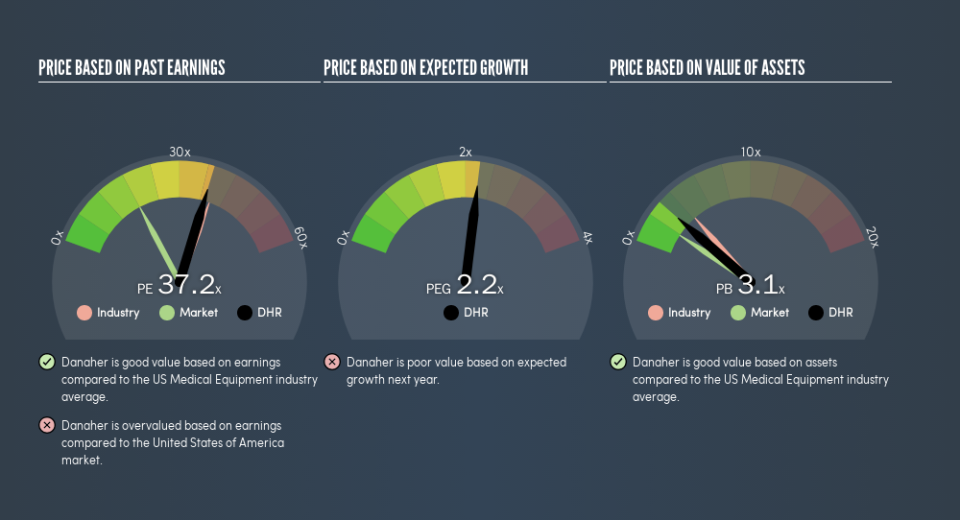
That indicates that the market expects Danaher will perform roughly in line with other companies in its industry. If the company has better than average prospects, then the market might be underestimating it. Further research into factors such asmanagement tenure, could help you form your own view on whether that is likely.
Don't Forget: The P/E Does Not Account For Debt or Bank Deposits
One drawback of using a P/E ratio is that it considers market capitalization, but not the balance sheet. In other words, it does not consider any debt or cash that the company may have on the balance sheet. Theoretically, a business can improve its earnings (and produce a lower P/E in the future) by investing in growth. That means taking on debt (or spending its cash).
Such spending might be good or bad, overall, but the key point here is that you need to look at debt to understand the P/E ratio in context.
Is Debt Impacting Danaher's P/E?
Danaher's net debt is 7.2% of its market cap. So it doesn't have as many options as it would with net cash, but its debt would not have much of an impact on its P/E ratio.
The Bottom Line On Danaher's P/E Ratio
Danaher trades on a P/E ratio of 37.2, which is above the US market average of 18.3. With modest debt but no EPS growth in the last year, it's fair to say the P/E implies some optimism about future earnings, from the market.
Investors should be looking to buy stocks that the market is wrong about. People often underestimate remarkable growth -- so investors can make money when fast growth is not fully appreciated. So this free visualization of the analyst consensus on future earnings could help you make the right decision about whether to buy, sell, or hold.
You might be able to find a better buy than Danaher. If you want a selection of possible winners, check out this free list of interesting companies that trade on a P/E below 20 (but have proven they can grow earnings).
We aim to bring you long-term focused research analysis driven by fundamental data. Note that our analysis may not factor in the latest price-sensitive company announcements or qualitative material.
If you spot an error that warrants correction, please contact the editor at editorial-team@simplywallst.com. This article by Simply Wall St is general in nature. It does not constitute a recommendation to buy or sell any stock, and does not take account of your objectives, or your financial situation. Simply Wall St has no position in the stocks mentioned. Thank you for reading.
