
 Yahoo Finance
 Here's How P/E Ratios Can Help Us Understand Flanigan's Enterprises, Inc. (NYSEMKT:BDL)

To the annoyance of some shareholders, Flanigan's Enterprises (NYSEMKT:BDL) shares are down a considerable in the last month. The recent drop has obliterated the annual return, with the share price now down 17% over that longer period.
Assuming no other changes, a sharply higher share price makes a stock less attractive to potential buyers. While the market sentiment towards a stock is very changeable, in the long run, the share price will tend to move in the same direction as earnings per share. The implication here is that deep value investors might steer clear when expectations of a company are too high. Perhaps the simplest way to get a read on investors' expectations of a business is to look at its Price to Earnings Ratio (PE Ratio). Investors have optimistic expectations of companies with higher P/E ratios, compared to companies with lower P/E ratios.
Check out our latest analysis for Flanigan's Enterprises
How Does Flanigan's Enterprises's P/E Ratio Compare To Its Peers?
Flanigan's Enterprises's P/E of 10.45 indicates relatively low sentiment towards the stock. If you look at the image below, you can see Flanigan's Enterprises has a lower P/E than the average (25.2) in the hospitality industry classification.
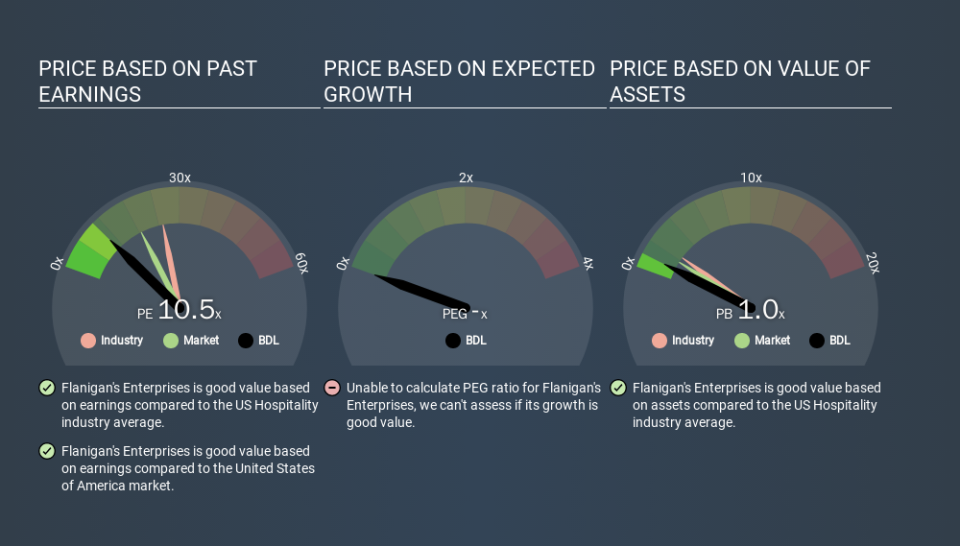
This suggests that market participants think Flanigan's Enterprises will underperform other companies in its industry. Since the market seems unimpressed with Flanigan's Enterprises, it's quite possible it could surprise on the upside. You should delve deeper. I like to check if company insiders have been buying or selling.
How Growth Rates Impact P/E Ratios
Generally speaking the rate of earnings growth has a profound impact on a company's P/E multiple. If earnings are growing quickly, then the 'E' in the equation will increase faster than it would otherwise. And in that case, the P/E ratio itself will drop rather quickly. So while a stock may look expensive based on past earnings, it could be cheap based on future earnings.
Flanigan's Enterprises's earnings per share were pretty steady over the last year. But over the longer term (5 years) earnings per share have increased by 5.7%.
Remember: P/E Ratios Don't Consider The Balance Sheet
Don't forget that the P/E ratio considers market capitalization. Thus, the metric does not reflect cash or debt held by the company. Hypothetically, a company could reduce its future P/E ratio by spending its cash (or taking on debt) to achieve higher earnings.
While growth expenditure doesn't always pay off, the point is that it is a good option to have; but one that the P/E ratio ignores.
Is Debt Impacting Flanigan's Enterprises's P/E?
The extra options and safety that comes with Flanigan's Enterprises's US$592k net cash position means that it deserves a higher P/E than it would if it had a lot of net debt.
The Bottom Line On Flanigan's Enterprises's P/E Ratio
Flanigan's Enterprises's P/E is 10.5 which is below average (18.5) in the US market. Falling earnings per share are likely to be keeping potential buyers away, but the net cash position means the company has time to improve: if so, the low P/E could be an opportunity. What can be absolutely certain is that the market has become less optimistic about Flanigan's Enterprises over the last month, with the P/E ratio falling from 10.5 back then to 10.5 today. For those who prefer to invest with the flow of momentum, that might be a bad sign, but for a contrarian, it may signal opportunity.
Investors have an opportunity when market expectations about a stock are wrong. If it is underestimating a company, investors can make money by buying and holding the shares until the market corrects itself. Although we don't have analyst forecasts you could get a better understanding of its growth by checking out this more detailed historical graph of earnings, revenue and cash flow.
Of course, you might find a fantastic investment by looking at a few good candidates. So take a peek at this free list of companies with modest (or no) debt, trading on a P/E below 20.
If you spot an error that warrants correction, please contact the editor at editorial-team@simplywallst.com. This article by Simply Wall St is general in nature. It does not constitute a recommendation to buy or sell any stock, and does not take account of your objectives, or your financial situation. Simply Wall St has no position in the stocks mentioned.
We aim to bring you long-term focused research analysis driven by fundamental data. Note that our analysis may not factor in the latest price-sensitive company announcements or qualitative material. Thank you for reading.
