
 Yahoo Finance
 Here's What Roche Bobois S.A.'s (EPA:RBO) P/E Is Telling Us

This article is for investors who would like to improve their understanding of price to earnings ratios (P/E ratios). We'll show how you can use Roche Bobois S.A.'s (EPA:RBO) P/E ratio to inform your assessment of the investment opportunity. Looking at earnings over the last twelve months, Roche Bobois has a P/E ratio of 16.97. That means that at current prices, buyers pay €16.97 for every €1 in trailing yearly profits.
Check out our latest analysis for Roche Bobois
How Do You Calculate A P/E Ratio?
The formula for price to earnings is:
Price to Earnings Ratio = Price per Share ÷ Earnings per Share (EPS)
Or for Roche Bobois:
P/E of 16.97 = €16.000 ÷ €0.943 (Based on the year to December 2019.)
(Note: the above calculation results may not be precise due to rounding.)
Is A High Price-to-Earnings Ratio Good?
The higher the P/E ratio, the higher the price tag of a business, relative to its trailing earnings. All else being equal, it's better to pay a low price -- but as Warren Buffett said, 'It's far better to buy a wonderful company at a fair price than a fair company at a wonderful price'.
How Does Roche Bobois's P/E Ratio Compare To Its Peers?
The P/E ratio indicates whether the market has higher or lower expectations of a company. You can see in the image below that the average P/E (13.7) for companies in the consumer durables industry is lower than Roche Bobois's P/E.
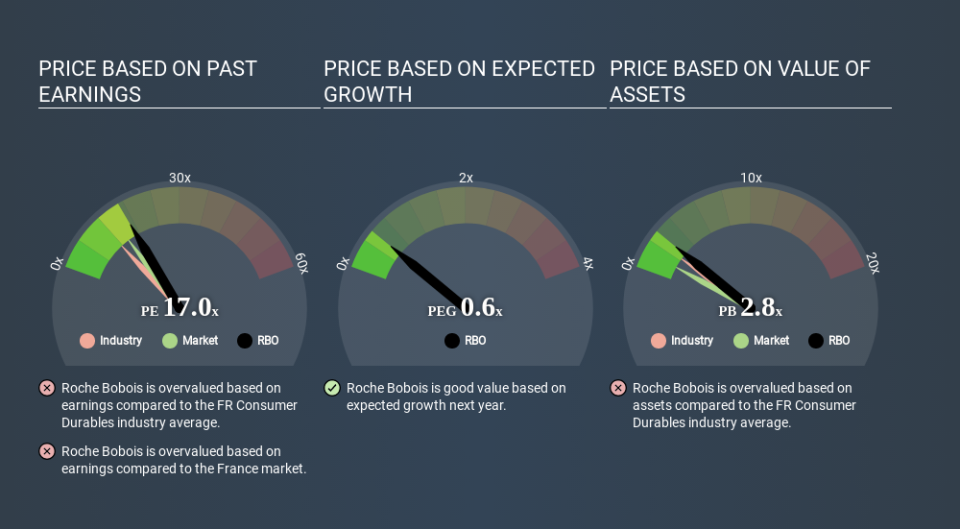
That means that the market expects Roche Bobois will outperform other companies in its industry. Clearly the market expects growth, but it isn't guaranteed. So further research is always essential. I often monitor director buying and selling.
How Growth Rates Impact P/E Ratios
P/E ratios primarily reflect market expectations around earnings growth rates. When earnings grow, the 'E' increases, over time. That means unless the share price increases, the P/E will reduce in a few years. Then, a lower P/E should attract more buyers, pushing the share price up.
It's nice to see that Roche Bobois grew EPS by a stonking 48% in the last year. And its annual EPS growth rate over 3 years is 1.3%. So we'd generally expect it to have a relatively high P/E ratio. In contrast, EPS has decreased by 3.3%, annually, over 5 years.
Remember: P/E Ratios Don't Consider The Balance Sheet
The 'Price' in P/E reflects the market capitalization of the company. In other words, it does not consider any debt or cash that the company may have on the balance sheet. In theory, a company can lower its future P/E ratio by using cash or debt to invest in growth.
Such spending might be good or bad, overall, but the key point here is that you need to look at debt to understand the P/E ratio in context.
So What Does Roche Bobois's Balance Sheet Tell Us?
Roche Bobois has net cash of €11m. That should lead to a higher P/E than if it did have debt, because its strong balance sheets gives it more options.
The Verdict On Roche Bobois's P/E Ratio
Roche Bobois has a P/E of 17.0. That's higher than the average in its market, which is 14.6. Its net cash position is the cherry on top of its superb EPS growth. To us, this is the sort of company that we would expect to carry an above average price tag (relative to earnings).
When the market is wrong about a stock, it gives savvy investors an opportunity. If the reality for a company is better than it expects, you can make money by buying and holding for the long term. So this free report on the analyst consensus forecasts could help you make a master move on this stock.
Of course you might be able to find a better stock than Roche Bobois. So you may wish to see this free collection of other companies that have grown earnings strongly.
Love or hate this article? Concerned about the content? Get in touch with us directly. Alternatively, email editorial-team@simplywallst.com.
This article by Simply Wall St is general in nature. It does not constitute a recommendation to buy or sell any stock, and does not take account of your objectives, or your financial situation. We aim to bring you long-term focused analysis driven by fundamental data. Note that our analysis may not factor in the latest price-sensitive company announcements or qualitative material. Simply Wall St has no position in any stocks mentioned. Thank you for reading.
