
 Yahoo Finance
 Here's What To Make Of Smartgroup's (ASX:SIQ) Decelerating Rates Of Return
What are the early trends we should look for to identify a stock that could multiply in value over the long term? Amongst other things, we'll want to see two things; firstly, a growing return on capital employed (ROCE) and secondly, an expansion in the company's amount of capital employed. Ultimately, this demonstrates that it's a business that is reinvesting profits at increasing rates of return. Having said that, while the ROCE is currently high for Smartgroup (ASX:SIQ), we aren't jumping out of our chairs because returns are decreasing.
What Is Return On Capital Employed (ROCE)?
For those who don't know, ROCE is a measure of a company's yearly pre-tax profit (its return), relative to the capital employed in the business. The formula for this calculation on Smartgroup is:
Return on Capital Employed = Earnings Before Interest and Tax (EBIT) ÷ (Total Assets - Current Liabilities)
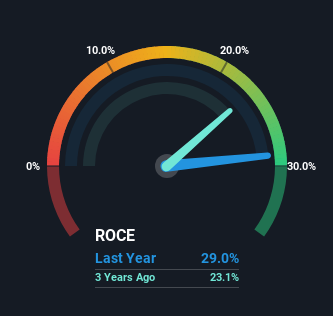
0.29 = AU$91m ÷ (AU$418m - AU$105m) (Based on the trailing twelve months to December 2023).
Thus, Smartgroup has an ROCE of 29%. In absolute terms that's a great return and it's even better than the Professional Services industry average of 15%.
Check out our latest analysis for Smartgroup
Above you can see how the current ROCE for Smartgroup compares to its prior returns on capital, but there's only so much you can tell from the past. If you're interested, you can view the analysts predictions in our free analyst report for Smartgroup .
How Are Returns Trending?
Over the past five years, Smartgroup's ROCE and capital employed have both remained mostly flat. Businesses with these traits tend to be mature and steady operations because they're past the growth phase. So it may not be a multi-bagger in the making, but given the decent 29% return on capital, it'd be difficult to find fault with the business's current operations. That probably explains why Smartgroup has been paying out 85% of its earnings as dividends to shareholders. These mature businesses typically have reliable earnings and not many places to reinvest them, so the next best option is to put the earnings into shareholders pockets.
The Bottom Line
While Smartgroup has impressive profitability from its capital, it isn't increasing that amount of capital. Although the market must be expecting these trends to improve because the stock has gained 79% over the last five years. But if the trajectory of these underlying trends continue, we think the likelihood of it being a multi-bagger from here isn't high.
One more thing, we've spotted 1 warning sign facing Smartgroup that you might find interesting.
Smartgroup is not the only stock earning high returns. If you'd like to see more, check out our free list of companies earning high returns on equity with solid fundamentals.
Have feedback on this article? Concerned about the content? Get in touch with us directly. Alternatively, email editorial-team (at) simplywallst.com.
This article by Simply Wall St is general in nature. We provide commentary based on historical data and analyst forecasts only using an unbiased methodology and our articles are not intended to be financial advice. It does not constitute a recommendation to buy or sell any stock, and does not take account of your objectives, or your financial situation. We aim to bring you long-term focused analysis driven by fundamental data. Note that our analysis may not factor in the latest price-sensitive company announcements or qualitative material. Simply Wall St has no position in any stocks mentioned.
