
 Yahoo Finance
 Here's What To Make Of Stamford Tyres' (SGX:S29) Decelerating Rates Of Return
What are the early trends we should look for to identify a stock that could multiply in value over the long term? In a perfect world, we'd like to see a company investing more capital into its business and ideally the returns earned from that capital are also increasing. Ultimately, this demonstrates that it's a business that is reinvesting profits at increasing rates of return. However, after briefly looking over the numbers, we don't think Stamford Tyres (SGX:S29) has the makings of a multi-bagger going forward, but let's have a look at why that may be.
What Is Return On Capital Employed (ROCE)?
For those that aren't sure what ROCE is, it measures the amount of pre-tax profits a company can generate from the capital employed in its business. The formula for this calculation on Stamford Tyres is:
Return on Capital Employed = Earnings Before Interest and Tax (EBIT) ÷ (Total Assets - Current Liabilities)
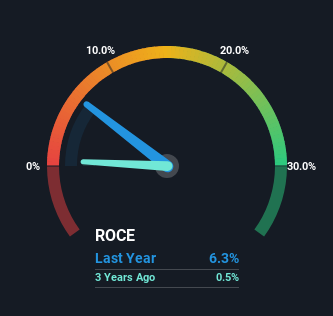
0.063 = S$8.6m ÷ (S$233m - S$96m) (Based on the trailing twelve months to April 2023).
So, Stamford Tyres has an ROCE of 6.3%. On its own that's a low return, but compared to the average of 4.6% generated by the Retail Distributors industry, it's much better.
View our latest analysis for Stamford Tyres
While the past is not representative of the future, it can be helpful to know how a company has performed historically, which is why we have this chart above. If you want to delve into the historical earnings, revenue and cash flow of Stamford Tyres, check out these free graphs here.
So How Is Stamford Tyres' ROCE Trending?
Things have been pretty stable at Stamford Tyres, with its capital employed and returns on that capital staying somewhat the same for the last five years. It's not uncommon to see this when looking at a mature and stable business that isn't re-investing its earnings because it has likely passed that phase of the business cycle. With that in mind, unless investment picks up again in the future, we wouldn't expect Stamford Tyres to be a multi-bagger going forward.
Another thing to note, Stamford Tyres has a high ratio of current liabilities to total assets of 41%. This can bring about some risks because the company is basically operating with a rather large reliance on its suppliers or other sorts of short-term creditors. While it's not necessarily a bad thing, it can be beneficial if this ratio is lower.
The Bottom Line On Stamford Tyres' ROCE
In summary, Stamford Tyres isn't compounding its earnings but is generating stable returns on the same amount of capital employed. And in the last five years, the stock has given away 25% so the market doesn't look too hopeful on these trends strengthening any time soon. Therefore based on the analysis done in this article, we don't think Stamford Tyres has the makings of a multi-bagger.
One final note, you should learn about the 3 warning signs we've spotted with Stamford Tyres (including 1 which is significant) .
If you want to search for solid companies with great earnings, check out this free list of companies with good balance sheets and impressive returns on equity.
Have feedback on this article? Concerned about the content? Get in touch with us directly. Alternatively, email editorial-team (at) simplywallst.com.
This article by Simply Wall St is general in nature. We provide commentary based on historical data and analyst forecasts only using an unbiased methodology and our articles are not intended to be financial advice. It does not constitute a recommendation to buy or sell any stock, and does not take account of your objectives, or your financial situation. We aim to bring you long-term focused analysis driven by fundamental data. Note that our analysis may not factor in the latest price-sensitive company announcements or qualitative material. Simply Wall St has no position in any stocks mentioned.
