
 Yahoo Finance
 Here's What Tate & Lyle plc's (LON:TATE) P/E Ratio Is Telling Us

Today, we'll introduce the concept of the P/E ratio for those who are learning about investing. We'll look at Tate & Lyle plc's (LON:TATE) P/E ratio and reflect on what it tells us about the company's share price. Tate & Lyle has a P/E ratio of 15.38, based on the last twelve months. In other words, at today's prices, investors are paying £15.38 for every £1 in prior year profit.
Check out our latest analysis for Tate & Lyle
How Do You Calculate A P/E Ratio?
The formula for P/E is:
Price to Earnings Ratio = Share Price ÷ Earnings per Share (EPS)
Or for Tate & Lyle:
P/E of 15.38 = £7.34 ÷ £0.48 (Based on the trailing twelve months to September 2018.)
Is A High Price-to-Earnings Ratio Good?
The higher the P/E ratio, the higher the price tag of a business, relative to its trailing earnings. That is not a good or a bad thing per se, but a high P/E does imply buyers are optimistic about the future.
How Growth Rates Impact P/E Ratios
Earnings growth rates have a big influence on P/E ratios. Earnings growth means that in the future the 'E' will be higher. And in that case, the P/E ratio itself will drop rather quickly. So while a stock may look expensive based on past earnings, it could be cheap based on future earnings.
Tate & Lyle's earnings per share fell by 12% in the last twelve months. But EPS is up 127% over the last 3 years. And it has shrunk its earnings per share by 2.0% per year over the last five years. This growth rate might warrant a below average P/E ratio.
Does Tate & Lyle Have A Relatively High Or Low P/E For Its Industry?
We can get an indication of market expectations by looking at the P/E ratio. We can see in the image below that the average P/E (19.7) for companies in the food industry is higher than Tate & Lyle's P/E.
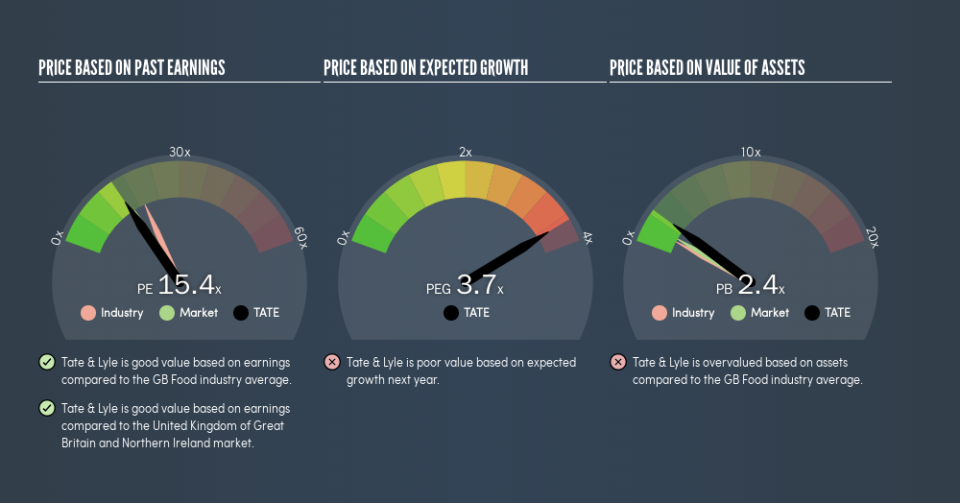
Its relatively low P/E ratio indicates that Tate & Lyle shareholders think it will struggle to do as well as other companies in its industry classification. While current expectations are low, the stock could be undervalued if the situation is better than the market assumes. It is arguably worth checking if insiders are buying shares, because that might imply they believe the stock is undervalued.
Remember: P/E Ratios Don't Consider The Balance Sheet
It's important to note that the P/E ratio considers the market capitalization, not the enterprise value. In other words, it does not consider any debt or cash that the company may have on the balance sheet. The exact same company would hypothetically deserve a higher P/E ratio if it had a strong balance sheet, than if it had a weak one with lots of debt, because a cashed up company can spend on growth.
Such spending might be good or bad, overall, but the key point here is that you need to look at debt to understand the P/E ratio in context.
How Does Tate & Lyle's Debt Impact Its P/E Ratio?
Net debt totals just 9.3% of Tate & Lyle's market cap. The market might award it a higher P/E ratio if it had net cash, but its unlikely this low level of net borrowing is having a big impact on the P/E multiple.
The Bottom Line On Tate & Lyle's P/E Ratio
Tate & Lyle trades on a P/E ratio of 15.4, which is fairly close to the GB market average of 16.3. Given it has some debt, but didn't grow last year, the P/E indicates the market is expecting higher profits ahead for the business.
Investors have an opportunity when market expectations about a stock are wrong. If the reality for a company is not as bad as the P/E ratio indicates, then the share price should increase as the market realizes this. So this free visualization of the analyst consensus on future earnings could help you make the right decision about whether to buy, sell, or hold.
Of course, you might find a fantastic investment by looking at a few good candidates. So take a peek at this free list of companies with modest (or no) debt, trading on a P/E below 20.
We aim to bring you long-term focused research analysis driven by fundamental data. Note that our analysis may not factor in the latest price-sensitive company announcements or qualitative material.
If you spot an error that warrants correction, please contact the editor at editorial-team@simplywallst.com. This article by Simply Wall St is general in nature. It does not constitute a recommendation to buy or sell any stock, and does not take account of your objectives, or your financial situation. Simply Wall St has no position in the stocks mentioned. Thank you for reading.
