
 Yahoo Finance
 Here's What We Think About B2Gold Corp.'s (TSE:BTO) CEO Pay

Clive Johnson has been the CEO of B2Gold Corp. (TSE:BTO) since 2007. This report will, first, examine the CEO compensation levels in comparison to CEO compensation at companies of similar size. After that, we will consider the growth in the business. Third, we'll reflect on the total return to shareholders over three years, as a second measure of business performance. The aim of all this is to consider the appropriateness of CEO pay levels.
View our latest analysis for B2Gold
How Does Clive Johnson's Compensation Compare With Similar Sized Companies?
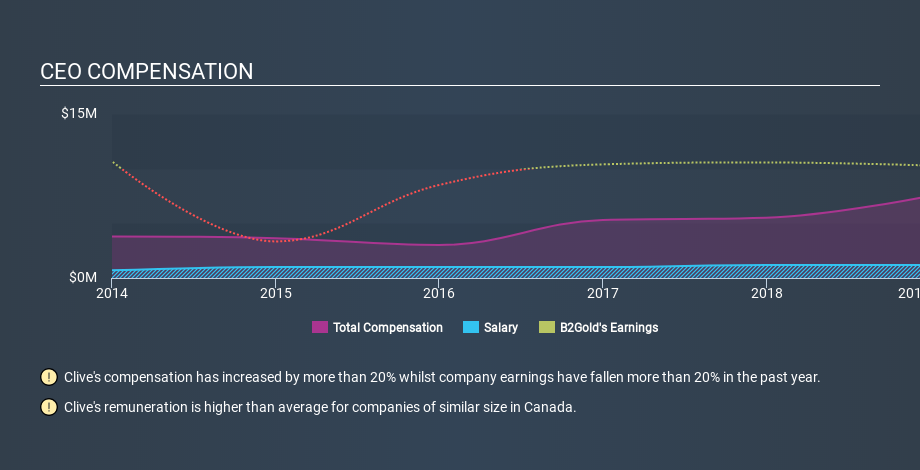
Our data indicates that B2Gold Corp. is worth CA$5.7b, and total annual CEO compensation was reported as US$7.5m for the year to December 2018. While this analysis focuses on total compensation, it's worth noting the salary is lower, valued at US$1.2m. We further remind readers that the CEO may face performance requirements to receive the non-salary part of the total compensation. We looked at a group of companies with market capitalizations from CA$2.6b to CA$8.4b, and the median CEO total compensation was CA$3.7m.
Thus we can conclude that Clive Johnson receives more in total compensation than the median of a group of companies in the same market, and of similar size to B2Gold Corp.. However, this doesn't necessarily mean the pay is too high. We can better assess whether the pay is overly generous by looking into the underlying business performance.
You can see, below, how CEO compensation at B2Gold has changed over time.
Is B2Gold Corp. Growing?
Over the last three years B2Gold Corp. has grown its earnings per share (EPS) by an average of 22% per year (using a line of best fit). It achieved revenue growth of 25% over the last year.
This shows that the company has improved itself over the last few years. Good news for shareholders. It's great to see that revenue growth is strong, too. These metrics suggest the business is growing strongly. Shareholders might be interested in this free visualization of analyst forecasts.
Has B2Gold Corp. Been A Good Investment?
I think that the total shareholder return of 45%, over three years, would leave most B2Gold Corp. shareholders smiling. This strong performance might mean some shareholders don't mind if the CEO were to be paid more than is normal for a company of its size.
In Summary...
We compared total CEO remuneration at B2Gold Corp. with the amount paid at companies with a similar market capitalization. We found that it pays well over the median amount paid in the benchmark group.
Importantly, though, the company has impressed with its earnings per share growth, over three years. Even better, returns to shareholders have been plentiful, over the same time period. So, considering this good performance, the CEO compensation may be quite appropriate. CEO compensation is one thing, but it is also interesting to check if the CEO is buying or selling B2Gold (free visualization of insider trades).
If you want to buy a stock that is better than B2Gold, this free list of high return, low debt companies is a great place to look.
If you spot an error that warrants correction, please contact the editor at editorial-team@simplywallst.com. This article by Simply Wall St is general in nature. It does not constitute a recommendation to buy or sell any stock, and does not take account of your objectives, or your financial situation. Simply Wall St has no position in the stocks mentioned.
We aim to bring you long-term focused research analysis driven by fundamental data. Note that our analysis may not factor in the latest price-sensitive company announcements or qualitative material. Thank you for reading.
