
 Yahoo Finance
 Here's What We Think About C-Rad AB (publ)'s (STO:CRAD B) CEO Pay

Tim Thurn became the CEO of C-Rad AB (publ) (STO:CRAD B) in 2013. First, this article will compare CEO compensation with compensation at similar sized companies. After that, we will consider the growth in the business. And finally we will reflect on how common stockholders have fared in the last few years, as a secondary measure of performance. The aim of all this is to consider the appropriateness of CEO pay levels.
View our latest analysis for C-Rad
How Does Tim Thurn's Compensation Compare With Similar Sized Companies?
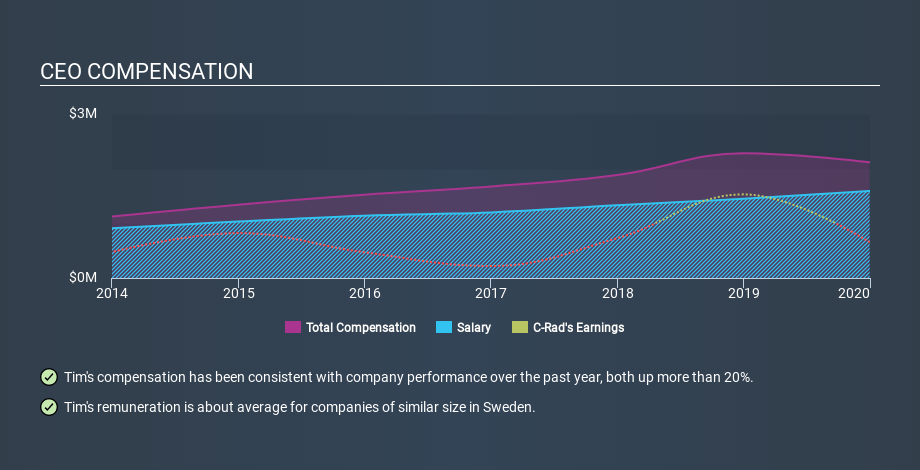
Our data indicates that C-Rad AB (publ) is worth kr986m, and total annual CEO compensation was reported as kr2.1m for the year to December 2019. That's less than last year. While we always look at total compensation first, we note that the salary component is less, at kr1.6m. We examined a group of similar sized companies, with market capitalizations of below kr2.0b. The median CEO total compensation in that group is kr2.1m.
Pay mix tells us a lot about how a company functions versus the wider industry, and it's no different in the case of C-Rad. On a sector level, around 68% of total compensation represents salary and 32% is other remuneration. C-Rad does not set aside a larger portion of remuneration in the form of salary, maintaining the same rate as the wider market.
So Tim Thurn is paid around the average of the companies we looked at. Although this fact alone doesn't tell us a great deal, it becomes more relevant when considered against the business performance. You can see a visual representation of the CEO compensation at C-Rad, below.
Is C-Rad AB (publ) Growing?
Over the last three years C-Rad AB (publ) has seen earnings per share (EPS) move in a positive direction by an average of 67% per year (using a line of best fit). In the last year, its revenue is up 3.1%.
This shows that the company has improved itself over the last few years. Good news for shareholders. It's also good to see modest revenue growth, suggesting the underlying business is healthy. Although we don't have analyst forecasts shareholders might want to examine this detailed historical graph of earnings, revenue and cash flow.
Has C-Rad AB (publ) Been A Good Investment?
Most shareholders would probably be pleased with C-Rad AB (publ) for providing a total return of 64% over three years. This strong performance might mean some shareholders don't mind if the CEO were to be paid more than is normal for a company of its size.
In Summary...
Tim Thurn is paid around the same as most CEOs of similar size companies.
The company is growing earnings per share and total shareholder returns have been pleasing. Indeed, many might consider the pay rather modest, given the solid company performance! Moving away from CEO compensation for the moment, we've identified 4 warning signs for C-Rad that you should be aware of before investing.
Important note: C-Rad may not be the best stock to buy. You might find something better in this list of interesting companies with high ROE and low debt.
Love or hate this article? Concerned about the content? Get in touch with us directly. Alternatively, email editorial-team@simplywallst.com.
This article by Simply Wall St is general in nature. It does not constitute a recommendation to buy or sell any stock, and does not take account of your objectives, or your financial situation. We aim to bring you long-term focused analysis driven by fundamental data. Note that our analysis may not factor in the latest price-sensitive company announcements or qualitative material. Simply Wall St has no position in any stocks mentioned. Thank you for reading.
