
 Yahoo Finance
 Here's What TKH Group N.V.'s (AMS:TWEKA) P/E Ratio Is Telling Us

Want to participate in a short research study? Help shape the future of investing tools and you could win a $250 gift card!
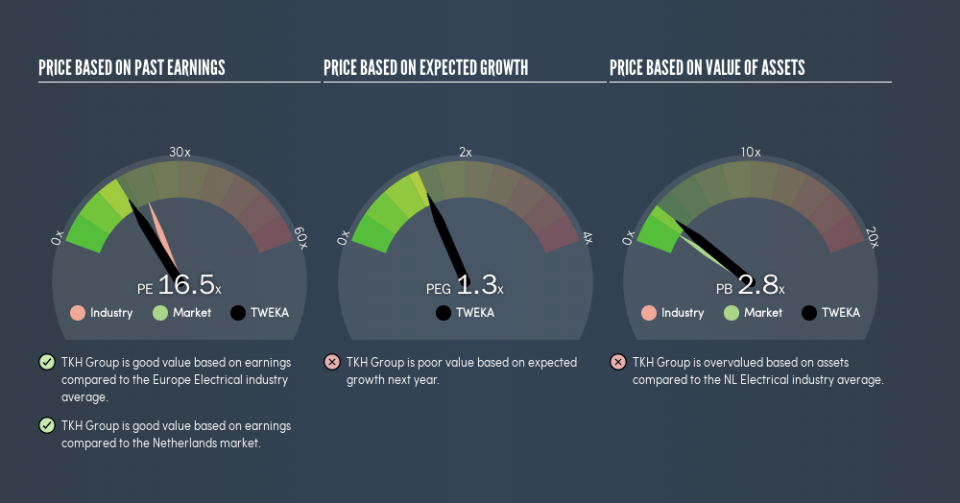
This article is written for those who want to get better at using price to earnings ratios (P/E ratios). We'll show how you can use TKH Group N.V.'s (AMS:TWEKA) P/E ratio to inform your assessment of the investment opportunity. TKH Group has a P/E ratio of 16.51, based on the last twelve months. In other words, at today's prices, investors are paying €16.51 for every €1 in prior year profit.
View our latest analysis for TKH Group
How Do I Calculate A Price To Earnings Ratio?
The formula for price to earnings is:
Price to Earnings Ratio = Share Price ÷ Earnings per Share (EPS)
Or for TKH Group:
P/E of 16.51 = €42.66 ÷ €2.58 (Based on the trailing twelve months to December 2018.)
Is A High Price-to-Earnings Ratio Good?
A higher P/E ratio implies that investors pay a higher price for the earning power of the business. All else being equal, it's better to pay a low price -- but as Warren Buffett said, 'It's far better to buy a wonderful company at a fair price than a fair company at a wonderful price.'
How Growth Rates Impact P/E Ratios
Probably the most important factor in determining what P/E a company trades on is the earnings growth. Earnings growth means that in the future the 'E' will be higher. And in that case, the P/E ratio itself will drop rather quickly. So while a stock may look expensive based on past earnings, it could be cheap based on future earnings.
TKH Group increased earnings per share by a whopping 26% last year. And its annual EPS growth rate over 5 years is 21%. So we'd generally expect it to have a relatively high P/E ratio.
Does TKH Group Have A Relatively High Or Low P/E For Its Industry?
We can get an indication of market expectations by looking at the P/E ratio. If you look at the image below, you can see TKH Group has a lower P/E than the average (21.3) in the electrical industry classification.
TKH Group's P/E tells us that market participants think it will not fare as well as its peers in the same industry. While current expectations are low, the stock could be undervalued if the situation is better than the market assumes. You should delve deeper. I like to check if company insiders have been buying or selling.
Don't Forget: The P/E Does Not Account For Debt or Bank Deposits
It's important to note that the P/E ratio considers the market capitalization, not the enterprise value. In other words, it does not consider any debt or cash that the company may have on the balance sheet. Hypothetically, a company could reduce its future P/E ratio by spending its cash (or taking on debt) to achieve higher earnings.
Spending on growth might be good or bad a few years later, but the point is that the P/E ratio does not account for the option (or lack thereof).
How Does TKH Group's Debt Impact Its P/E Ratio?
TKH Group's net debt is 18% of its market cap. It would probably deserve a higher P/E ratio if it was net cash, since it would have more options for growth.
The Verdict On TKH Group's P/E Ratio
TKH Group's P/E is 16.5 which is about average (17.2) in the NL market. With only modest debt levels, and strong earnings growth, the market seems to doubt that the growth can be maintained. Since analysts are predicting growth will continue, one might expect to see a higher P/E so it may be worth looking closer.
Investors should be looking to buy stocks that the market is wrong about. If the reality for a company is not as bad as the P/E ratio indicates, then the share price should increase as the market realizes this. So this free report on the analyst consensus forecasts could help you make a master move on this stock.
Of course, you might find a fantastic investment by looking at a few good candidates. So take a peek at this free list of companies with modest (or no) debt, trading on a P/E below 20.
We aim to bring you long-term focused research analysis driven by fundamental data. Note that our analysis may not factor in the latest price-sensitive company announcements or qualitative material.
If you spot an error that warrants correction, please contact the editor at editorial-team@simplywallst.com. This article by Simply Wall St is general in nature. It does not constitute a recommendation to buy or sell any stock, and does not take account of your objectives, or your financial situation. Simply Wall St has no position in the stocks mentioned. Thank you for reading.
