
 Yahoo Finance
 Here's What Tomra Systems ASA's (OB:TOM) P/E Is Telling Us

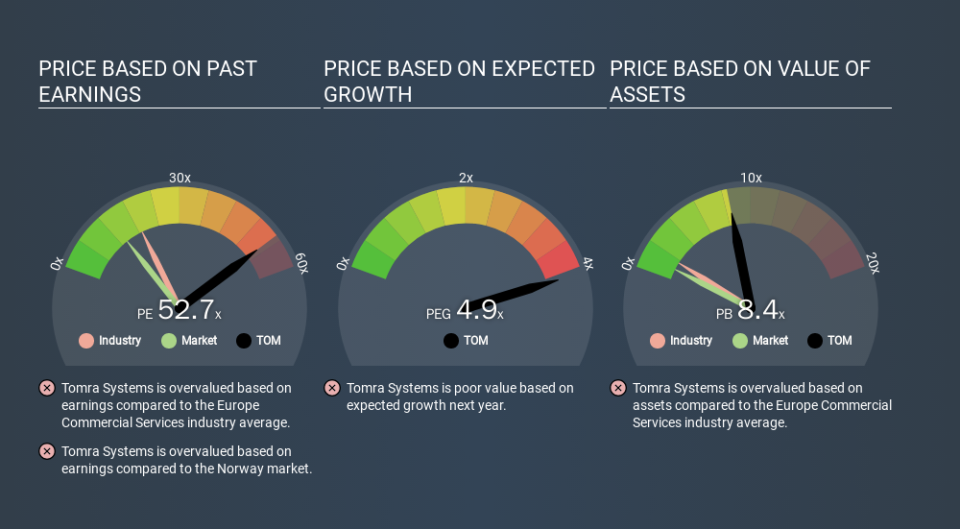
This article is written for those who want to get better at using price to earnings ratios (P/E ratios). We'll apply a basic P/E ratio analysis to Tomra Systems ASA's (OB:TOM), to help you decide if the stock is worth further research. What is Tomra Systems's P/E ratio? Well, based on the last twelve months it is 52.74. That is equivalent to an earnings yield of about 1.9%.
See our latest analysis for Tomra Systems
How Do I Calculate Tomra Systems's Price To Earnings Ratio?
The formula for P/E is:
Price to Earnings Ratio = Share Price ÷ Earnings per Share (EPS)
Or for Tomra Systems:
P/E of 52.74 = NOK281.80 ÷ NOK5.34 (Based on the trailing twelve months to September 2019.)
Is A High Price-to-Earnings Ratio Good?
A higher P/E ratio means that buyers have to pay a higher price for each NOK1 the company has earned over the last year. That isn't a good or a bad thing on its own, but a high P/E means that buyers have a higher opinion of the business's prospects, relative to stocks with a lower P/E.
How Does Tomra Systems's P/E Ratio Compare To Its Peers?
One good way to get a quick read on what market participants expect of a company is to look at its P/E ratio. The image below shows that Tomra Systems has a higher P/E than the average (18.9) P/E for companies in the commercial services industry.
That means that the market expects Tomra Systems will outperform other companies in its industry. The market is optimistic about the future, but that doesn't guarantee future growth. So further research is always essential. I often monitor director buying and selling.
How Growth Rates Impact P/E Ratios
Earnings growth rates have a big influence on P/E ratios. If earnings are growing quickly, then the 'E' in the equation will increase faster than it would otherwise. Therefore, even if you pay a high multiple of earnings now, that multiple will become lower in the future. A lower P/E should indicate the stock is cheap relative to others -- and that may attract buyers.
Tomra Systems increased earnings per share by an impressive 19% over the last twelve months. And its annual EPS growth rate over 5 years is 16%. This could arguably justify a relatively high P/E ratio.
Don't Forget: The P/E Does Not Account For Debt or Bank Deposits
Don't forget that the P/E ratio considers market capitalization. In other words, it does not consider any debt or cash that the company may have on the balance sheet. Theoretically, a business can improve its earnings (and produce a lower P/E in the future) by investing in growth. That means taking on debt (or spending its cash).
Such spending might be good or bad, overall, but the key point here is that you need to look at debt to understand the P/E ratio in context.
Tomra Systems's Balance Sheet
Net debt totals just 3.9% of Tomra Systems's market cap. It would probably trade on a higher P/E ratio if it had a lot of cash, but I doubt it is having a big impact.
The Bottom Line On Tomra Systems's P/E Ratio
With a P/E ratio of 52.7, Tomra Systems is expected to grow earnings very strongly in the years to come. Its debt levels do not imperil its balance sheet and it is growing EPS strongly. So on this analysis it seems reasonable that its P/E ratio is above average.
When the market is wrong about a stock, it gives savvy investors an opportunity. If the reality for a company is better than it expects, you can make money by buying and holding for the long term. So this free visualization of the analyst consensus on future earnings could help you make the right decision about whether to buy, sell, or hold.
But note: Tomra Systems may not be the best stock to buy. So take a peek at this free list of interesting companies with strong recent earnings growth (and a P/E ratio below 20).
If you spot an error that warrants correction, please contact the editor at editorial-team@simplywallst.com. This article by Simply Wall St is general in nature. It does not constitute a recommendation to buy or sell any stock, and does not take account of your objectives, or your financial situation. Simply Wall St has no position in the stocks mentioned.
We aim to bring you long-term focused research analysis driven by fundamental data. Note that our analysis may not factor in the latest price-sensitive company announcements or qualitative material. Thank you for reading.
