
 Yahoo Finance
 Here's What's Concerning About Berentzen-Gruppe's (ETR:BEZ) Returns On Capital
What financial metrics can indicate to us that a company is maturing or even in decline? More often than not, we'll see a declining return on capital employed (ROCE) and a declining amount of capital employed. This indicates the company is producing less profit from its investments and its total assets are decreasing. So after glancing at the trends within Berentzen-Gruppe (ETR:BEZ), we weren't too hopeful.
Return On Capital Employed (ROCE): What Is It?
Just to clarify if you're unsure, ROCE is a metric for evaluating how much pre-tax income (in percentage terms) a company earns on the capital invested in its business. Analysts use this formula to calculate it for Berentzen-Gruppe:
Return on Capital Employed = Earnings Before Interest and Tax (EBIT) ÷ (Total Assets - Current Liabilities)
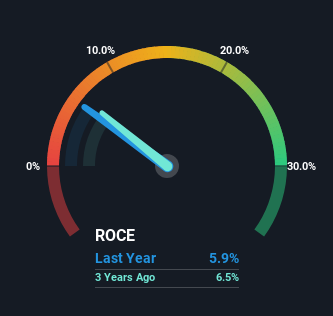
0.059 = €3.4m ÷ (€139m - €81m) (Based on the trailing twelve months to June 2023).
Thus, Berentzen-Gruppe has an ROCE of 5.9%. Even though it's in line with the industry average of 5.9%, it's still a low return by itself.
Check out our latest analysis for Berentzen-Gruppe
In the above chart we have measured Berentzen-Gruppe's prior ROCE against its prior performance, but the future is arguably more important. If you'd like, you can check out the forecasts from the analysts covering Berentzen-Gruppe here for free.
The Trend Of ROCE
We are a bit worried about the trend of returns on capital at Berentzen-Gruppe. About five years ago, returns on capital were 11%, however they're now substantially lower than that as we saw above. And on the capital employed front, the business is utilizing roughly the same amount of capital as it was back then. Since returns are falling and the business has the same amount of assets employed, this can suggest it's a mature business that hasn't had much growth in the last five years. So because these trends aren't typically conducive to creating a multi-bagger, we wouldn't hold our breath on Berentzen-Gruppe becoming one if things continue as they have.
Another thing to note, Berentzen-Gruppe has a high ratio of current liabilities to total assets of 59%. This effectively means that suppliers (or short-term creditors) are funding a large portion of the business, so just be aware that this can introduce some elements of risk. Ideally we'd like to see this reduce as that would mean fewer obligations bearing risks.
The Bottom Line On Berentzen-Gruppe's ROCE
In the end, the trend of lower returns on the same amount of capital isn't typically an indication that we're looking at a growth stock. Investors must expect better things on the horizon though because the stock has risen 6.0% in the last five years. Regardless, we don't like the trends as they are and if they persist, we think you might find better investments elsewhere.
On a final note, we found 4 warning signs for Berentzen-Gruppe (2 are potentially serious) you should be aware of.
While Berentzen-Gruppe may not currently earn the highest returns, we've compiled a list of companies that currently earn more than 25% return on equity. Check out this free list here.
Have feedback on this article? Concerned about the content? Get in touch with us directly. Alternatively, email editorial-team (at) simplywallst.com.
This article by Simply Wall St is general in nature. We provide commentary based on historical data and analyst forecasts only using an unbiased methodology and our articles are not intended to be financial advice. It does not constitute a recommendation to buy or sell any stock, and does not take account of your objectives, or your financial situation. We aim to bring you long-term focused analysis driven by fundamental data. Note that our analysis may not factor in the latest price-sensitive company announcements or qualitative material. Simply Wall St has no position in any stocks mentioned.
