
 Yahoo Finance
 Here's What's Concerning About iomart Group's (LON:IOM) Returns On Capital
Finding a business that has the potential to grow substantially is not easy, but it is possible if we look at a few key financial metrics. Typically, we'll want to notice a trend of growing return on capital employed (ROCE) and alongside that, an expanding base of capital employed. Basically this means that a company has profitable initiatives that it can continue to reinvest in, which is a trait of a compounding machine. In light of that, when we looked at iomart Group (LON:IOM) and its ROCE trend, we weren't exactly thrilled.
Understanding Return On Capital Employed (ROCE)
For those that aren't sure what ROCE is, it measures the amount of pre-tax profits a company can generate from the capital employed in its business. The formula for this calculation on iomart Group is:
Return on Capital Employed = Earnings Before Interest and Tax (EBIT) ÷ (Total Assets - Current Liabilities)
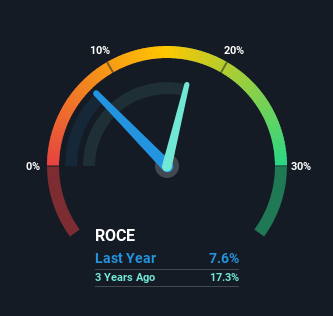
0.076 = UK£15m ÷ (UK£228m - UK£33m) (Based on the trailing twelve months to March 2021).
Therefore, iomart Group has an ROCE of 7.6%. In absolute terms, that's a low return and it also under-performs the IT industry average of 13%.
See our latest analysis for iomart Group
Above you can see how the current ROCE for iomart Group compares to its prior returns on capital, but there's only so much you can tell from the past. If you'd like, you can check out the forecasts from the analysts covering iomart Group here for free.
What Does the ROCE Trend For iomart Group Tell Us?
On the surface, the trend of ROCE at iomart Group doesn't inspire confidence. To be more specific, ROCE has fallen from 15% over the last five years. On the other hand, the company has been employing more capital without a corresponding improvement in sales in the last year, which could suggest these investments are longer term plays. It's worth keeping an eye on the company's earnings from here on to see if these investments do end up contributing to the bottom line.
On a related note, iomart Group has decreased its current liabilities to 14% of total assets. So we could link some of this to the decrease in ROCE. What's more, this can reduce some aspects of risk to the business because now the company's suppliers or short-term creditors are funding less of its operations. Some would claim this reduces the business' efficiency at generating ROCE since it is now funding more of the operations with its own money.
Our Take On iomart Group's ROCE
Bringing it all together, while we're somewhat encouraged by iomart Group's reinvestment in its own business, we're aware that returns are shrinking. And investors appear hesitant that the trends will pick up because the stock has fallen 35% in the last five years. Therefore based on the analysis done in this article, we don't think iomart Group has the makings of a multi-bagger.
iomart Group does have some risks, we noticed 4 warning signs (and 1 which is potentially serious) we think you should know about.
For those who like to invest in solid companies, check out this free list of companies with solid balance sheets and high returns on equity.
This article by Simply Wall St is general in nature. We provide commentary based on historical data and analyst forecasts only using an unbiased methodology and our articles are not intended to be financial advice. It does not constitute a recommendation to buy or sell any stock, and does not take account of your objectives, or your financial situation. We aim to bring you long-term focused analysis driven by fundamental data. Note that our analysis may not factor in the latest price-sensitive company announcements or qualitative material. Simply Wall St has no position in any stocks mentioned.
Have feedback on this article? Concerned about the content? Get in touch with us directly. Alternatively, email editorial-team (at) simplywallst.com.
