
 Yahoo Finance
 Historically Bullish Fourth Quarter Living Up to the Hype
“History doesn’t repeat itself, but it often rhymes.” – Mark Twain
I’ve always been intrigued by the strategic aspects of the stock market. Knowing that having more relevant information can ultimately lead to better investment outcomes, I’ve explored far and wide to identify patterns that repeat themselves over time. My research led me to seasonal tendencies that have shown predictive power spanning many decades. To me, the best way to approach the market is with a strategy that has a long history of profitability.
While this market has been difficult to navigate, even for the most seasoned investor, using history as our guide can help us determine what to expect moving forward. As Mr. Twain said long ago, history can serve as a useful guide. And while it likely won’t repeat itself exactly, it often rhymes and patterns can play out to a similar tune.
The efficient market theory tells us that share prices reflect all information and that stocks always trade at their fair market values. But market cycles have repeatedly illustrated that prices can diverge widely from those purported values, creating very profitable opportunities along the way. Calendar anomalies are an example of regular, exploitable patterns in the stock market that deviate from the norm.
Today we’re focusing on a specific calendar anomaly that holds special interest right now: the 4-year Presidential Cycle (devised by Yale Hirsch of the Stock Trader’s Almanac). And oddly enough, this year has played out in sync with the cycle, albeit more drastic than average.
The U.S. midterm elections are top of mind in November, and for good reason. Apart from their importance for voters, investors eagerly await this bullish time of year. We know that markets don’t like indecision, and the elections bring a culmination of that uncertainty as we enter a seasonally favorable time of year. Let’s take a closer look at this cycle and see what we can learn about the months and years ahead.
The Presidential Election Cycle Theory
This theory suggests that the stock market follows a pattern which correlates with a U.S. president’s four-year term. The election cycle consists of the post-election, midterm, pre-election and election years. 2022 is an example of a midterm year, or the second year in the 4-year presidential cycle.
In the first two years after an election, unpopular measures become more frequent, putting pressure on share prices. The second year tends to be the weakest year of all four years, as the president continues attempting to fulfill campaign promises. Congressional elections take place – and with them, they bring the potential to shift the political backdrop.
Continued . . .
------------------------------------------------------------------------------------------------------
Revealed: Zacks’ Midterm Election Predictions
The elections could mark the beginning of an especially profitable time for investors.
Midterm Election Profits: 5 Stocks Set to Soar features 5 picks you’ll want to buy before the elections. According to our research, these stocks are likely to climb the most after election day. Previous reports led investors to gains of +71%, +83%, even +185%¹ – and this year’s returns could be just as impressive.
The Midterm Election Profits: 5 Stocks Set to Soar report is only available until midnight Sunday, November 6.
See Midterm Election Stocks Now >>
------------------------------------------------------------------------------------------------------
Hirsch discovered that wars, recessions, and bear markets (sound familiar?) tend to start in the first two years of a president’s term. This year, the market entered the weak spot of the cycle. And with an aggressive Fed, high inflation, and the ongoing Russia-Ukraine war, the weakness in stocks was amplified.
Those who know their market history will find it somewhat unsurprising that the start to this year was rough. The second and third quarters of midterm years are historically quite weak. As we can see below, dating back to 1950, these have historically been some of the weakest quarters, averaging -2.1% and 0.5%, respectively. And we saw the second quarter this year play out negatively with the S&P 500 falling nearly -17%, while the blue-chip index fell another -5% during Q3. But more prosperous times typically lie ahead in the latter half of the cycle.
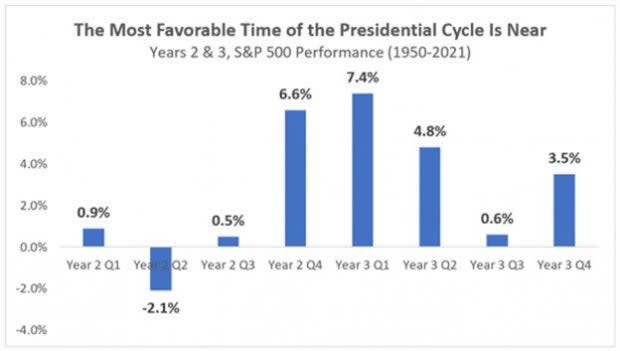
Image Source: Zacks Investment Research
The good news is that the weak part of the cycle immediately precedes the most bullish part of the calendar. We’re now well into Q4 of year 2 in the 4-year presidential cycle – the second-strongest quarter of all 16 quarters, sporting an average return of 6.6%. Even better, Q4 in midterm years is followed by the strongest quarter of all – Q1 of year 3 with a 7.4% average gain.
At the end of this September, the S&P 500 was down 24.8% on the year. Dating back to World War II, only 1974 and 2002 saw worse starts to a year. Can you guess what happened in the fourth quarter in each of those years?
Both years saw the S&P 500 gain nearly 8% in the historically bullish fourth quarter. In 1974, stocks bottomed on October 3rd, while in ’02 the bear bottomed on October 9th. These stats are part of a data set that has earned October a reputation as a “bear market killer”. Since 1956, six of the last fifteen bear markets (40%) ended in October. Could October 12th join the list?
Adding to the bullish case, the Dow just saw its best October (+13.96%) in history. What happened next in years where the Dow had such a huge monthly performance in October?
In 1982 and 2002, the Dow gained over 10% during the Halloween-themed month. Both ended bear markets, and stocks saw large multi-year gains follow.
And when we factor in that the third year of the presidential cycle has historically witnessed the best performance of all four years, the future looks bright following a market reset that pushed equity prices much lower. Under new presidents, pre-election years have witnessed an average return north of 20% going back to 1950.
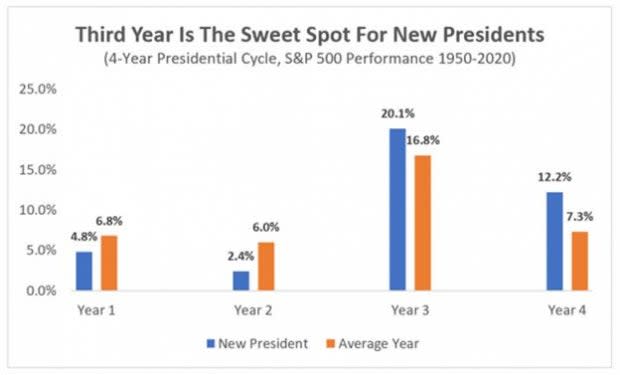
Image Source: Zacks Investment Research
Investors would do well to take notice of the positive seasonality currently underway. The market normally improves in the latter half of the term as the president attempts to stimulate the economy, making voters feel more positive in an effort to get reelected or keep the current party in power. The central bank, which is not completely independent, also seems to support the president in office through monetary policy in the second half. And sure enough, the odds of rate cuts have increased in 2024.
Putting It All Together – Expect the Unexpected
The chart below shows the average price pattern for the US equity markets over the four-year election cycle. Notice how years three and four tend to be more constructive, with the third year the strongest of them all. Bear markets tend to put in a midterm year bottom sometime in the August-October timeframe just ahead of the midterm elections.
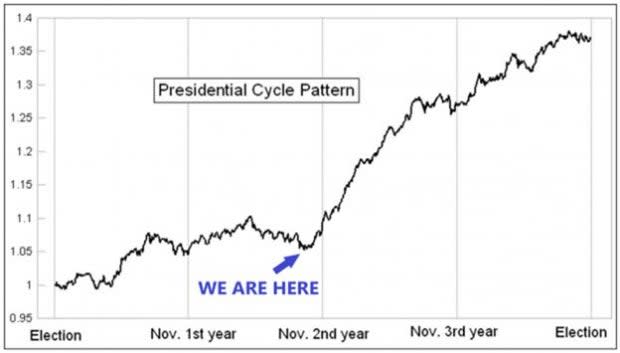
Image Source: StockCharts, McClellan FP
The November-April timeframe is historically the best six months of the four-year presidential cycle. In fact, dating back to 1950, this six-month stretch has been higher 18 out of the past 18 times (100%) starting in a midterm year and ending in a pre-election year, sporting an average return of 15.2%. We may be in the midst of an eye-popping rally, just when the average investor is ready to give up on stocks. And on the tech side, from the midterm low to the pre-election year high, the NASDAQ has seen an incredible 68.2% average return dating back to 1974!
With investor sentiment near historic lows, a large percentage of individual investors bearish, and positive seasonality underway, conditions have been ripe for stocks to begin rallying from oversold levels. In addition, an aggressive Fed has begun to drop hints of slowing the future pace of rate hikes. Instead of viewing the performance of stocks negatively this year, we can think of it as part of a necessary cycle – one that is paving the way for individual stocks to experience stellar returns. A great potential entry point for investors, and extraordinary gains likely lie on the other side.
In our brand-new special report, we highlight 5 of the stocks we expect to be especially lucrative for investors in the weeks and months ahead.
Midterm Election Profits: 5 Stocks Set to Soar reveals companies likely to benefit greatly from the post-election clarity in Washington. Each company is a leader in an industry receiving targeted investments from both the government and Wall Street. Plus, all 5 have already forecast higher earnings, despite this year’s economic slump. They see promising developments on the horizon.
To maximize your profit potential, you’ll want to grab these stocks before shares start to climb. And with the election just 2 days away, now is the time to take action.
Here at Zacks, we have an outstanding track record for picking money-making election stocks. In previous elections. Our picks have pointed readers to gains up to +67%, +83%, even +185%.¹ These midterms could be just as lucrative.
This special report is only available until Sunday, November 6. Don’t delay – download the report today and position yourself for outsize gains with our top election picks.
Click here to claim your copy of Midterm Election Profits: 5 Stocks Set to Soar >>
Wishing You the Best on Your Investing Journey,
Bryan
Bryan Hayes, CFA manages our Zacks Income Investor and Headline Trader portfolios. He employs a combination of fundamental and technical analysis and has developed a unique approach to selecting stocks with the best profit potential.
¹ The results listed above are not (or may not be) representative of the performance of all selections made by Zacks Investment Research's newsletter editors and may represent the partial close of a position.
Want the latest recommendations from Zacks Investment Research? Today, you can download 7 Best Stocks for the Next 30 Days. Click to get this free report
To read this article on Zacks.com click here.
Zacks Investment Research
