
 Yahoo Finance
 Ho Wah Genting Berhad (KLSE:HWGB) Might Have The Makings Of A Multi-Bagger
Did you know there are some financial metrics that can provide clues of a potential multi-bagger? In a perfect world, we'd like to see a company investing more capital into its business and ideally the returns earned from that capital are also increasing. If you see this, it typically means it's a company with a great business model and plenty of profitable reinvestment opportunities. So when we looked at Ho Wah Genting Berhad (KLSE:HWGB) and its trend of ROCE, we really liked what we saw.
Understanding Return On Capital Employed (ROCE)
For those that aren't sure what ROCE is, it measures the amount of pre-tax profits a company can generate from the capital employed in its business. The formula for this calculation on Ho Wah Genting Berhad is:
Return on Capital Employed = Earnings Before Interest and Tax (EBIT) ÷ (Total Assets - Current Liabilities)
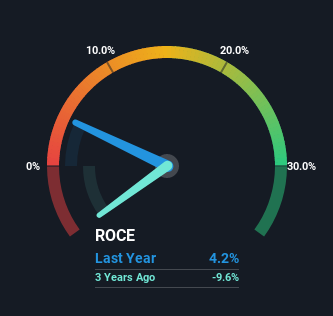
0.042 = RM3.7m ÷ (RM132m - RM45m) (Based on the trailing twelve months to December 2022).
So, Ho Wah Genting Berhad has an ROCE of 4.2%. In absolute terms, that's a low return and it also under-performs the Electrical industry average of 9.3%.
See our latest analysis for Ho Wah Genting Berhad
While the past is not representative of the future, it can be helpful to know how a company has performed historically, which is why we have this chart above. If you'd like to look at how Ho Wah Genting Berhad has performed in the past in other metrics, you can view this free graph of past earnings, revenue and cash flow.
What The Trend Of ROCE Can Tell Us
We're delighted to see that Ho Wah Genting Berhad is reaping rewards from its investments and is now generating some pre-tax profits. Shareholders would no doubt be pleased with this because the business was loss-making five years ago but is is now generating 4.2% on its capital. Not only that, but the company is utilizing 119% more capital than before, but that's to be expected from a company trying to break into profitability. This can indicate that there's plenty of opportunities to invest capital internally and at ever higher rates, both common traits of a multi-bagger.
In another part of our analysis, we noticed that the company's ratio of current liabilities to total assets decreased to 34%, which broadly means the business is relying less on its suppliers or short-term creditors to fund its operations. So shareholders would be pleased that the growth in returns has mostly come from underlying business performance.
The Key Takeaway
In summary, it's great to see that Ho Wah Genting Berhad has managed to break into profitability and is continuing to reinvest in its business. Astute investors may have an opportunity here because the stock has declined 21% in the last five years. With that in mind, we believe the promising trends warrant this stock for further investigation.
One more thing, we've spotted 3 warning signs facing Ho Wah Genting Berhad that you might find interesting.
While Ho Wah Genting Berhad isn't earning the highest return, check out this free list of companies that are earning high returns on equity with solid balance sheets.
Have feedback on this article? Concerned about the content? Get in touch with us directly. Alternatively, email editorial-team (at) simplywallst.com.
This article by Simply Wall St is general in nature. We provide commentary based on historical data and analyst forecasts only using an unbiased methodology and our articles are not intended to be financial advice. It does not constitute a recommendation to buy or sell any stock, and does not take account of your objectives, or your financial situation. We aim to bring you long-term focused analysis driven by fundamental data. Note that our analysis may not factor in the latest price-sensitive company announcements or qualitative material. Simply Wall St has no position in any stocks mentioned.
Join A Paid User Research Session
You’ll receive a US$30 Amazon Gift card for 1 hour of your time while helping us build better investing tools for the individual investors like yourself. Sign up here
