
 Yahoo Finance
 Update: HOCHTIEF (ETR:HOT) Stock Gained 97% In The Last Five Years

Generally speaking the aim of active stock picking is to find companies that provide returns that are superior to the market average. And in our experience, buying the right stocks can give your wealth a significant boost. To wit, the HOCHTIEF share price has climbed 97% in five years, easily topping the market return of 24% (ignoring dividends).
See our latest analysis for HOCHTIEF
In his essay The Superinvestors of Graham-and-Doddsville Warren Buffett described how share prices do not always rationally reflect the value of a business. By comparing earnings per share (EPS) and share price changes over time, we can get a feel for how investor attitudes to a company have morphed over time.
During the last half decade, HOCHTIEF became profitable. That would generally be considered a positive, so we'd expect the share price to be up. Since the company was unprofitable five years ago, but not three years ago, it's worth taking a look at the returns in the last three years, too. In fact, the HOCHTIEF stock price is 10% lower in the last three years. During the same period, EPS grew by 25% each year. So there seems to be a mismatch between the positive EPS growth and the change in the share price, which is down -3.6% per year.
The image below shows how EPS has tracked over time (if you click on the image you can see greater detail).
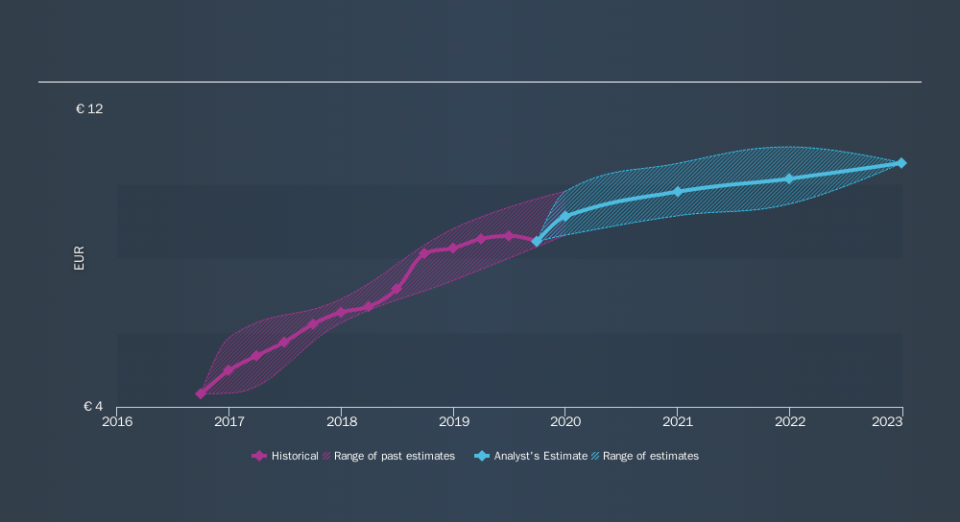
Dive deeper into HOCHTIEF's key metrics by checking this interactive graph of HOCHTIEF's earnings, revenue and cash flow.
What About Dividends?
It is important to consider the total shareholder return, as well as the share price return, for any given stock. The TSR incorporates the value of any spin-offs or discounted capital raisings, along with any dividends, based on the assumption that the dividends are reinvested. Arguably, the TSR gives a more comprehensive picture of the return generated by a stock. In the case of HOCHTIEF, it has a TSR of 124% for the last 5 years. That exceeds its share price return that we previously mentioned. This is largely a result of its dividend payments!
A Different Perspective
HOCHTIEF shareholders are down 12% for the year (even including dividends) , but the market itself is up 12%. However, keep in mind that even the best stocks will sometimes underperform the market over a twelve month period. On the bright side, long term shareholders have made money, with a gain of 17% per year over half a decade. If the fundamental data continues to indicate long term sustainable growth, the current sell-off could be an opportunity worth considering. Importantly, we haven't analysed HOCHTIEF's dividend history. This free visual report on its dividends is a must-read if you're thinking of buying.
But note: HOCHTIEF may not be the best stock to buy. So take a peek at this free list of interesting companies with past earnings growth (and further growth forecast).
Please note, the market returns quoted in this article reflect the market weighted average returns of stocks that currently trade on DE exchanges.
We aim to bring you long-term focused research analysis driven by fundamental data. Note that our analysis may not factor in the latest price-sensitive company announcements or qualitative material.
If you spot an error that warrants correction, please contact the editor at editorial-team@simplywallst.com. This article by Simply Wall St is general in nature. It does not constitute a recommendation to buy or sell any stock, and does not take account of your objectives, or your financial situation. Simply Wall St has no position in the stocks mentioned. Thank you for reading.
