
 Yahoo Finance
 Is At Home Group Inc.'s (NYSE:HOME) P/E Ratio Really That Good?

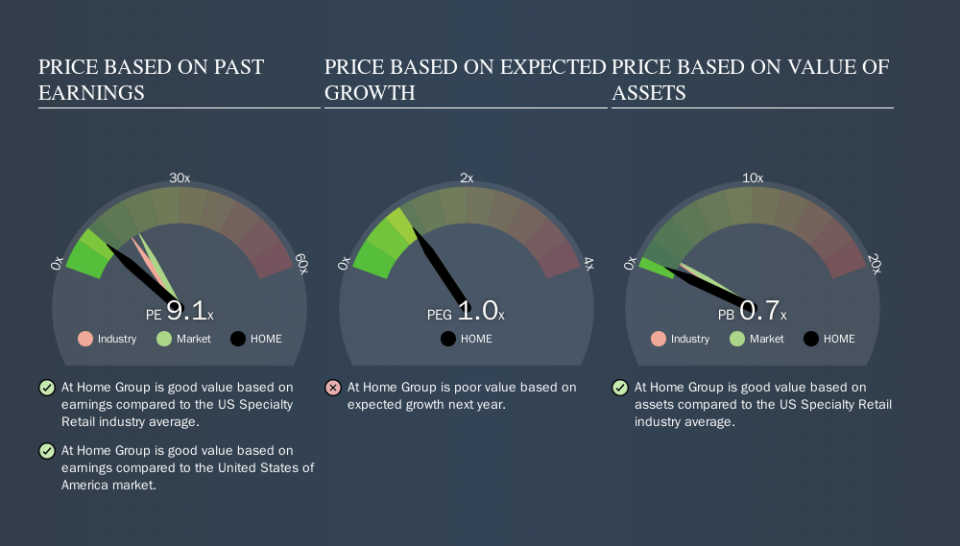
This article is written for those who want to get better at using price to earnings ratios (P/E ratios). We'll look at At Home Group Inc.'s (NYSE:HOME) P/E ratio and reflect on what it tells us about the company's share price. What is At Home Group's P/E ratio? Well, based on the last twelve months it is 9.11. That corresponds to an earnings yield of approximately 11.0%.
See our latest analysis for At Home Group
How Do I Calculate A Price To Earnings Ratio?
The formula for P/E is:
Price to Earnings Ratio = Price per Share ÷ Earnings per Share (EPS)
Or for At Home Group:
P/E of 9.11 = $9.29 ÷ $1.02 (Based on the year to July 2019.)
Is A High P/E Ratio Good?
A higher P/E ratio implies that investors pay a higher price for the earning power of the business. That isn't a good or a bad thing on its own, but a high P/E means that buyers have a higher opinion of the business's prospects, relative to stocks with a lower P/E.
How Does At Home Group's P/E Ratio Compare To Its Peers?
One good way to get a quick read on what market participants expect of a company is to look at its P/E ratio. If you look at the image below, you can see At Home Group has a lower P/E than the average (15.5) in the specialty retail industry classification.
Its relatively low P/E ratio indicates that At Home Group shareholders think it will struggle to do as well as other companies in its industry classification. Since the market seems unimpressed with At Home Group, it's quite possible it could surprise on the upside. It is arguably worth checking if insiders are buying shares, because that might imply they believe the stock is undervalued.
How Growth Rates Impact P/E Ratios
Companies that shrink earnings per share quickly will rapidly decrease the 'E' in the equation. That means even if the current P/E is low, it will increase over time if the share price stays flat. So while a stock may look cheap based on past earnings, it could be expensive based on future earnings.
At Home Group's earnings made like a rocket, taking off 202% last year. Regrettably, the longer term performance is poor, with EPS down per year over 3 years.
A Limitation: P/E Ratios Ignore Debt and Cash In The Bank
The 'Price' in P/E reflects the market capitalization of the company. That means it doesn't take debt or cash into account. Theoretically, a business can improve its earnings (and produce a lower P/E in the future) by investing in growth. That means taking on debt (or spending its cash).
Such expenditure might be good or bad, in the long term, but the point here is that the balance sheet is not reflected by this ratio.
At Home Group's Balance Sheet
At Home Group's net debt is considerable, at 103% of its market cap. This level of debt justifies a relatively low P/E, so remain cognizant of the debt, if you're comparing it to other stocks.
The Bottom Line On At Home Group's P/E Ratio
At Home Group trades on a P/E ratio of 9.1, which is below the US market average of 17.9. The company may have significant debt, but EPS growth was good last year. If the company can continue to grow earnings, then the current P/E may be unjustifiably low.
Investors have an opportunity when market expectations about a stock are wrong. If it is underestimating a company, investors can make money by buying and holding the shares until the market corrects itself. So this free visual report on analyst forecasts could hold the key to an excellent investment decision.
Of course you might be able to find a better stock than At Home Group. So you may wish to see this free collection of other companies that have grown earnings strongly.
We aim to bring you long-term focused research analysis driven by fundamental data. Note that our analysis may not factor in the latest price-sensitive company announcements or qualitative material.
If you spot an error that warrants correction, please contact the editor at editorial-team@simplywallst.com. This article by Simply Wall St is general in nature. It does not constitute a recommendation to buy or sell any stock, and does not take account of your objectives, or your financial situation. Simply Wall St has no position in the stocks mentioned. Thank you for reading.
