
 Yahoo Finance
 Honeywell International Inc's Dividend Analysis
Exploring the Sustainability and Growth of Honeywell International Inc's Dividend Payments
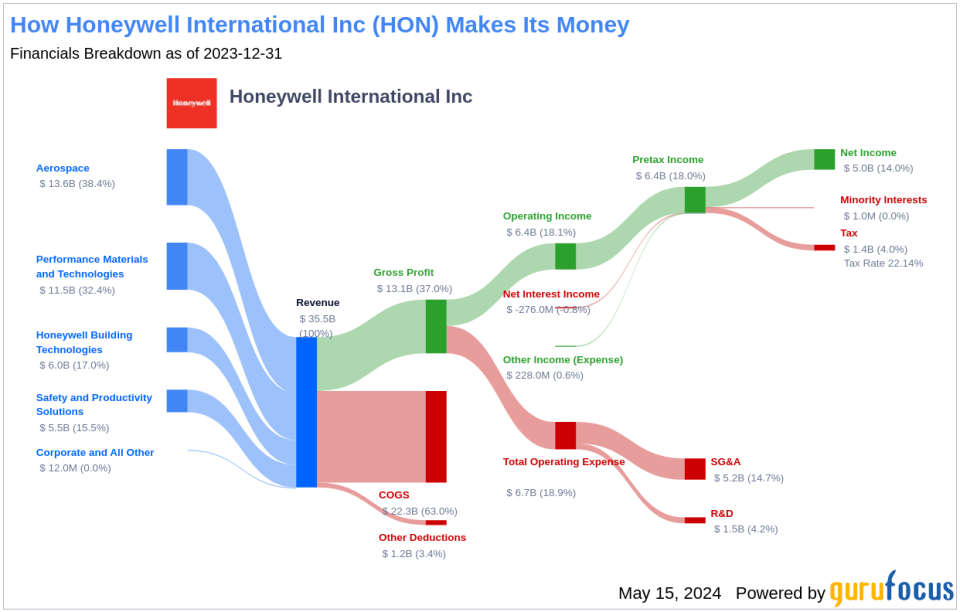
Honeywell International Inc (NASDAQ:HON) recently announced a dividend of $1.08 per share, payable on June 7, 2024, with the ex-dividend date set for May 16, 2024. As investors look forward to this upcoming payment, the spotlight also shines on the company's dividend history, yield, and growth rates. Using the data from GuruFocus, let's look into Honeywell International Inc's dividend performance and assess its sustainability.
What Does Honeywell International Inc Do?
This Powerful Chart Made Peter Lynch 29% A Year For 13 Years
How to calculate the intrinsic value of a stock?
Honeywell traces its roots to 1885 with Albert Butz's firm, Butz-Thermo Electric Regulator, which produced a predecessor to the modern thermostat. Today, Honeywell is a global multi-industry behemoth with one of the largest installed bases of equipment. It operates through four business segments: aerospace, building technologies, performance materials and technologies, and safety and productivity solutions. In recent years, the firm has made several portfolio changes, including the addition of Intelligrated in 2016, as well as the spinoffs of Garrett and Resideo in 2018. In 2019, the firm launched Honeywell Forge, its enterprise performance management software solution that leverages the firm's domain expertise in buildings, airlines, and critical infrastructure.
A Glimpse at Honeywell International Inc's Dividend History
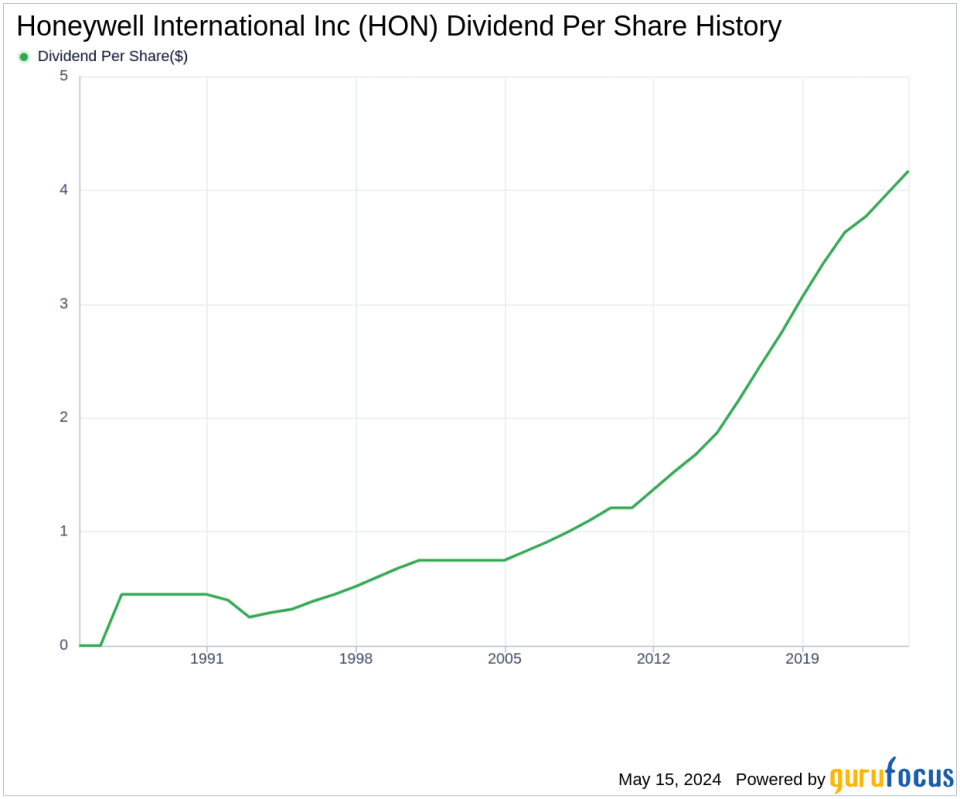
Honeywell International Inc has maintained a consistent dividend payment record since 1986. Dividends are currently distributed on a quarterly basis. Honeywell International Inc has increased its dividend each year since 1992. The stock is thus listed as a dividend aristocrat, an honor that is given to companies that have increased their dividend each year for at least the past 32 years.
Breaking Down Honeywell International Inc's Dividend Yield and Growth
As of today, Honeywell International Inc currently has a 12-month trailing dividend yield of 2.06% and a 12-month forward dividend yield of 2.11%. This suggests an expectation of increased dividend payments over the next 12 months. Over the past three years, Honeywell International Inc's annual dividend growth rate was 4.70%. Extended to a five-year horizon, this rate increased to 6.20% per year. And over the past decade, Honeywell International Inc's annual dividends per share growth rate stands at 9.80%.

The Sustainability Question: Payout Ratio and Profitability
To assess the sustainability of the dividend, one needs to evaluate the company's payout ratio. The dividend payout ratio provides insights into the portion of earnings the company distributes as dividends. A lower ratio suggests that the company retains a significant part of its earnings, thereby ensuring the availability of funds for future growth and unexpected downturns. As of March 31, 2024, Honeywell International Inc's dividend payout ratio is 0.44. Honeywell International Inc's profitability rank, offers an understanding of the company's earnings prowess relative to its peers. GuruFocus ranks Honeywell International Inc's profitability 8 out of 10 as of March 31, 2024, suggesting good profitability prospects. The company has reported positive net income for each of year over the past decade, further solidifying its high profitability.
Growth Metrics: The Future Outlook
To ensure the sustainability of dividends, a company must have robust growth metrics. Honeywell International Inc's growth rank of 8 out of 10 suggests that the company's growth trajectory is good relative to its competitors. Revenue is the lifeblood of any company, and Honeywell International Inc's revenue per share, combined with the 3-year revenue growth rate, indicates a strong revenue model. Honeywell International Inc's revenue has increased by approximately 6.10% per year on average, a rate that underperforms than approximately 54.85% of global competitors. The company's 3-year EPS growth rate showcases its capability to grow its earnings, a critical component for sustaining dividends in the long run. During the past three years, Honeywell International Inc's earnings increased by approximately 13.50% per year on average, a rate that underperforms than approximately 53.89% of global competitors. Lastly, the company's 5-year EBITDA growth rate of 0.60%, which underperforms than approximately 72.44% of global competitors.
Next Steps
Considering Honeywell International Inc's consistent dividend payments, growth in dividend rates, and a stable payout ratio alongside solid profitability metrics, the company appears well-positioned to continue rewarding its shareholders. The growth metrics, although mixed, still support a cautiously optimistic outlook for the sustainability of dividends. Investors should keep an eye on these indicators to gauge future performance. GuruFocus Premium users can screen for high-dividend yield stocks using the High Dividend Yield Screener.
This article, generated by GuruFocus, is designed to provide general insights and is not tailored financial advice. Our commentary is rooted in historical data and analyst projections, utilizing an impartial methodology, and is not intended to serve as specific investment guidance. It does not formulate a recommendation to purchase or divest any stock and does not consider individual investment objectives or financial circumstances. Our objective is to deliver long-term, fundamental data-driven analysis. Be aware that our analysis might not incorporate the most recent, price-sensitive company announcements or qualitative information. GuruFocus holds no position in the stocks mentioned herein.
This article first appeared on GuruFocus.
