
 Yahoo Finance
 Hostmore (LON:MORE) Has Some Difficulty Using Its Capital Effectively
Ignoring the stock price of a company, what are the underlying trends that tell us a business is past the growth phase? More often than not, we'll see a declining return on capital employed (ROCE) and a declining amount of capital employed. This combination can tell you that not only is the company investing less, it's earning less on what it does invest. On that note, looking into Hostmore (LON:MORE), we weren't too upbeat about how things were going.
Return On Capital Employed (ROCE): What Is It?
If you haven't worked with ROCE before, it measures the 'return' (pre-tax profit) a company generates from capital employed in its business. Analysts use this formula to calculate it for Hostmore:
Return on Capital Employed = Earnings Before Interest and Tax (EBIT) ÷ (Total Assets - Current Liabilities)
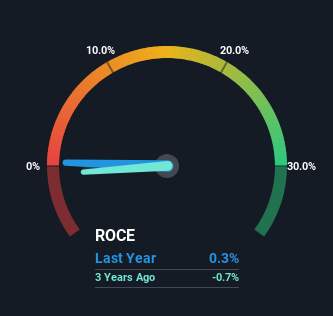
0.0031 = UK£536k ÷ (UK£228m - UK£57m) (Based on the trailing twelve months to July 2023).
Thus, Hostmore has an ROCE of 0.3%. In absolute terms, that's a low return and it also under-performs the Hospitality industry average of 7.0%.
View our latest analysis for Hostmore
In the above chart we have measured Hostmore's prior ROCE against its prior performance, but the future is arguably more important. If you're interested, you can view the analysts predictions in our free analyst report for Hostmore .
What Can We Tell From Hostmore's ROCE Trend?
We are a bit worried about the trend of returns on capital at Hostmore. To be more specific, the ROCE was 13% four years ago, but since then it has dropped noticeably. On top of that, it's worth noting that the amount of capital employed within the business has remained relatively steady. Companies that exhibit these attributes tend to not be shrinking, but they can be mature and facing pressure on their margins from competition. So because these trends aren't typically conducive to creating a multi-bagger, we wouldn't hold our breath on Hostmore becoming one if things continue as they have.
On a side note, Hostmore has done well to pay down its current liabilities to 25% of total assets. So we could link some of this to the decrease in ROCE. Effectively this means their suppliers or short-term creditors are funding less of the business, which reduces some elements of risk. Since the business is basically funding more of its operations with it's own money, you could argue this has made the business less efficient at generating ROCE.
The Bottom Line On Hostmore's ROCE
In the end, the trend of lower returns on the same amount of capital isn't typically an indication that we're looking at a growth stock. However the stock has delivered a 44% return to shareholders over the last year, so investors might be expecting the trends to turn around. In any case, the current underlying trends don't bode well for long term performance so unless they reverse, we'd start looking elsewhere.
Since virtually every company faces some risks, it's worth knowing what they are, and we've spotted 2 warning signs for Hostmore (of which 1 can't be ignored!) that you should know about.
While Hostmore isn't earning the highest return, check out this free list of companies that are earning high returns on equity with solid balance sheets.
Have feedback on this article? Concerned about the content? Get in touch with us directly. Alternatively, email editorial-team (at) simplywallst.com.
This article by Simply Wall St is general in nature. We provide commentary based on historical data and analyst forecasts only using an unbiased methodology and our articles are not intended to be financial advice. It does not constitute a recommendation to buy or sell any stock, and does not take account of your objectives, or your financial situation. We aim to bring you long-term focused analysis driven by fundamental data. Note that our analysis may not factor in the latest price-sensitive company announcements or qualitative material. Simply Wall St has no position in any stocks mentioned.
