
 Yahoo Finance
 Is Hudson Technologies, Inc. (NASDAQ:HDSN) Trading At A 24% Discount?
Key Insights
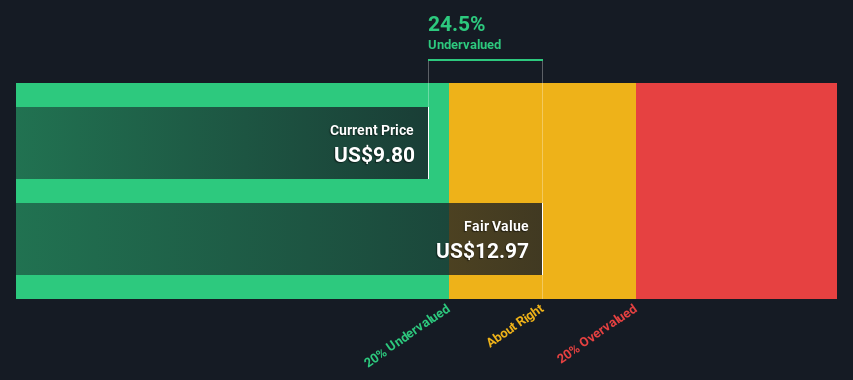
Using the 2 Stage Free Cash Flow to Equity, Hudson Technologies fair value estimate is US$12.97
Hudson Technologies is estimated to be 24% undervalued based on current share price of US$9.80
Our fair value estimate is 10% lower than Hudson Technologies' analyst price target of US$14.44
Today we will run through one way of estimating the intrinsic value of Hudson Technologies, Inc. (NASDAQ:HDSN) by projecting its future cash flows and then discounting them to today's value. We will use the Discounted Cash Flow (DCF) model on this occasion. It may sound complicated, but actually it is quite simple!
Companies can be valued in a lot of ways, so we would point out that a DCF is not perfect for every situation. If you still have some burning questions about this type of valuation, take a look at the Simply Wall St analysis model.
Check out our latest analysis for Hudson Technologies
What's The Estimated Valuation?
We're using the 2-stage growth model, which simply means we take in account two stages of company's growth. In the initial period the company may have a higher growth rate and the second stage is usually assumed to have a stable growth rate. In the first stage we need to estimate the cash flows to the business over the next ten years. Where possible we use analyst estimates, but when these aren't available we extrapolate the previous free cash flow (FCF) from the last estimate or reported value. We assume companies with shrinking free cash flow will slow their rate of shrinkage, and that companies with growing free cash flow will see their growth rate slow, over this period. We do this to reflect that growth tends to slow more in the early years than it does in later years.
Generally we assume that a dollar today is more valuable than a dollar in the future, so we discount the value of these future cash flows to their estimated value in today's dollars:
10-year free cash flow (FCF) estimate
2024 | 2025 | 2026 | 2027 | 2028 | 2029 | 2030 | 2031 | 2032 | 2033 | |
Levered FCF ($, Millions) | US$22.0m | US$43.6m | US$38.5m | US$35.7m | US$34.1m | US$33.2m | US$32.9m | US$32.9m | US$33.1m | US$33.5m |
Growth Rate Estimate Source | Analyst x1 | Analyst x1 | Est @ -11.69% | Est @ -7.47% | Est @ -4.51% | Est @ -2.45% | Est @ -1.00% | Est @ 0.02% | Est @ 0.72% | Est @ 1.22% |
Present Value ($, Millions) Discounted @ 7.2% | US$20.5 | US$38.0 | US$31.3 | US$27.0 | US$24.0 | US$21.9 | US$20.2 | US$18.8 | US$17.7 | US$16.7 |
("Est" = FCF growth rate estimated by Simply Wall St)
Present Value of 10-year Cash Flow (PVCF) = US$236m
The second stage is also known as Terminal Value, this is the business's cash flow after the first stage. The Gordon Growth formula is used to calculate Terminal Value at a future annual growth rate equal to the 5-year average of the 10-year government bond yield of 2.4%. We discount the terminal cash flows to today's value at a cost of equity of 7.2%.
Terminal Value (TV)= FCF2033 × (1 + g) ÷ (r – g) = US$34m× (1 + 2.4%) ÷ (7.2%– 2.4%) = US$711m
Present Value of Terminal Value (PVTV)= TV / (1 + r)10= US$711m÷ ( 1 + 7.2%)10= US$354m
The total value is the sum of cash flows for the next ten years plus the discounted terminal value, which results in the Total Equity Value, which in this case is US$590m. The last step is to then divide the equity value by the number of shares outstanding. Compared to the current share price of US$9.8, the company appears a touch undervalued at a 24% discount to where the stock price trades currently. The assumptions in any calculation have a big impact on the valuation, so it is better to view this as a rough estimate, not precise down to the last cent.
The Assumptions
Now the most important inputs to a discounted cash flow are the discount rate, and of course, the actual cash flows. You don't have to agree with these inputs, I recommend redoing the calculations yourself and playing with them. The DCF also does not consider the possible cyclicality of an industry, or a company's future capital requirements, so it does not give a full picture of a company's potential performance. Given that we are looking at Hudson Technologies as potential shareholders, the cost of equity is used as the discount rate, rather than the cost of capital (or weighted average cost of capital, WACC) which accounts for debt. In this calculation we've used 7.2%, which is based on a levered beta of 1.050. Beta is a measure of a stock's volatility, compared to the market as a whole. We get our beta from the industry average beta of globally comparable companies, with an imposed limit between 0.8 and 2.0, which is a reasonable range for a stable business.
SWOT Analysis for Hudson Technologies
Strength
Currently debt free.
Weakness
Earnings declined over the past year.
Opportunity
Annual earnings are forecast to grow for the next 2 years.
Good value based on P/E ratio and estimated fair value.
Threat
Annual earnings are forecast to grow slower than the American market.
Moving On:
Whilst important, the DCF calculation ideally won't be the sole piece of analysis you scrutinize for a company. It's not possible to obtain a foolproof valuation with a DCF model. Instead the best use for a DCF model is to test certain assumptions and theories to see if they would lead to the company being undervalued or overvalued. For example, changes in the company's cost of equity or the risk free rate can significantly impact the valuation. Can we work out why the company is trading at a discount to intrinsic value? For Hudson Technologies, there are three further elements you should explore:
Risks: Case in point, we've spotted 1 warning sign for Hudson Technologies you should be aware of.
Future Earnings: How does HDSN's growth rate compare to its peers and the wider market? Dig deeper into the analyst consensus number for the upcoming years by interacting with our free analyst growth expectation chart.
Other Solid Businesses: Low debt, high returns on equity and good past performance are fundamental to a strong business. Why not explore our interactive list of stocks with solid business fundamentals to see if there are other companies you may not have considered!
PS. Simply Wall St updates its DCF calculation for every American stock every day, so if you want to find the intrinsic value of any other stock just search here.
Have feedback on this article? Concerned about the content? Get in touch with us directly. Alternatively, email editorial-team (at) simplywallst.com.
This article by Simply Wall St is general in nature. We provide commentary based on historical data and analyst forecasts only using an unbiased methodology and our articles are not intended to be financial advice. It does not constitute a recommendation to buy or sell any stock, and does not take account of your objectives, or your financial situation. We aim to bring you long-term focused analysis driven by fundamental data. Note that our analysis may not factor in the latest price-sensitive company announcements or qualitative material. Simply Wall St has no position in any stocks mentioned.
