
 Yahoo Finance
 Humm Group (ASX:HUM) shareholders have endured a 57% loss from investing in the stock five years ago
While not a mind-blowing move, it is good to see that the Humm Group Limited (ASX:HUM) share price has gained 20% in the last three months. But that can't change the reality that over the longer term (five years), the returns have been really quite dismal. The share price has failed to impress anyone , down a sizable 64% during that time. So is the recent increase sufficient to restore confidence in the stock? Not yet. But it could be that the fall was overdone.
With that in mind, it's worth seeing if the company's underlying fundamentals have been the driver of long term performance, or if there are some discrepancies.
Check out our latest analysis for Humm Group
There is no denying that markets are sometimes efficient, but prices do not always reflect underlying business performance. One imperfect but simple way to consider how the market perception of a company has shifted is to compare the change in the earnings per share (EPS) with the share price movement.
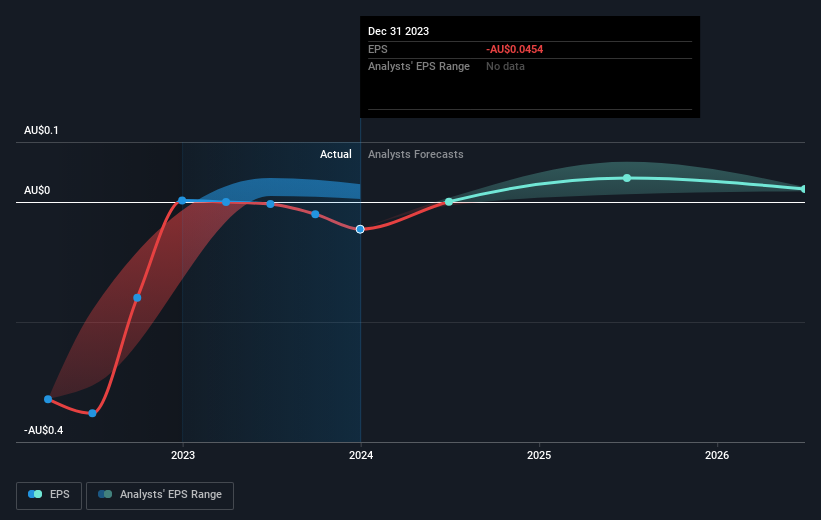
Over five years Humm Group's earnings per share dropped significantly, falling to a loss, with the share price also lower. At present it's hard to make valid comparisons between EPS and the share price. However, we can say we'd expect to see a falling share price in this scenario.
The graphic below depicts how EPS has changed over time (unveil the exact values by clicking on the image).
We like that insiders have been buying shares in the last twelve months. Even so, future earnings will be far more important to whether current shareholders make money. This free interactive report on Humm Group's earnings, revenue and cash flow is a great place to start, if you want to investigate the stock further.
What About Dividends?
It is important to consider the total shareholder return, as well as the share price return, for any given stock. The TSR incorporates the value of any spin-offs or discounted capital raisings, along with any dividends, based on the assumption that the dividends are reinvested. So for companies that pay a generous dividend, the TSR is often a lot higher than the share price return. As it happens, Humm Group's TSR for the last 5 years was -57%, which exceeds the share price return mentioned earlier. This is largely a result of its dividend payments!
A Different Perspective
Humm Group's TSR for the year was broadly in line with the market average, at 11%. To take a positive view, the gain is pleasing, and it sure beats annualized TSR loss of 9%, which was endured over half a decade. We're pretty skeptical of turnaround stories, but it's good to see the recent share price recovery. It's always interesting to track share price performance over the longer term. But to understand Humm Group better, we need to consider many other factors. Consider risks, for instance. Every company has them, and we've spotted 2 warning signs for Humm Group you should know about.
There are plenty of other companies that have insiders buying up shares. You probably do not want to miss this free list of growing companies that insiders are buying.
Please note, the market returns quoted in this article reflect the market weighted average returns of stocks that currently trade on Australian exchanges.
Have feedback on this article? Concerned about the content? Get in touch with us directly. Alternatively, email editorial-team (at) simplywallst.com.
This article by Simply Wall St is general in nature. We provide commentary based on historical data and analyst forecasts only using an unbiased methodology and our articles are not intended to be financial advice. It does not constitute a recommendation to buy or sell any stock, and does not take account of your objectives, or your financial situation. We aim to bring you long-term focused analysis driven by fundamental data. Note that our analysis may not factor in the latest price-sensitive company announcements or qualitative material. Simply Wall St has no position in any stocks mentioned.
