
 Yahoo Finance
 What Is Hunter Douglas's (AMS:HDG) P/E Ratio After Its Share Price Tanked?

Unfortunately for some shareholders, the Hunter Douglas (AMS:HDG) share price has dived 31% in the last thirty days. Indeed the recent decline has arguably caused some bitterness for shareholders who have held through the 31% drop over twelve months.
Assuming nothing else has changed, a lower share price makes a stock more attractive to potential buyers. While the market sentiment towards a stock is very changeable, in the long run, the share price will tend to move in the same direction as earnings per share. So, on certain occasions, long term focussed investors try to take advantage of pessimistic expectations to buy shares at a better price. Perhaps the simplest way to get a read on investors' expectations of a business is to look at its Price to Earnings Ratio (PE Ratio). Investors have optimistic expectations of companies with higher P/E ratios, compared to companies with lower P/E ratios.
See our latest analysis for Hunter Douglas
Does Hunter Douglas Have A Relatively High Or Low P/E For Its Industry?
We can tell from its P/E ratio of 5.94 that sentiment around Hunter Douglas isn't particularly high. The image below shows that Hunter Douglas has a lower P/E than the average (10.0) P/E for companies in the consumer durables industry.
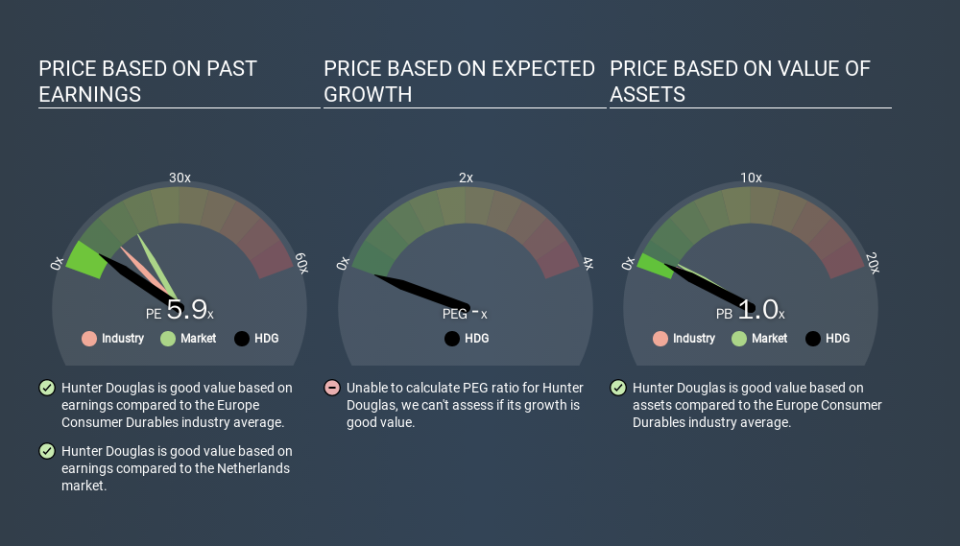
Hunter Douglas's P/E tells us that market participants think it will not fare as well as its peers in the same industry. Since the market seems unimpressed with Hunter Douglas, it's quite possible it could surprise on the upside. You should delve deeper. I like to check if company insiders have been buying or selling.
How Growth Rates Impact P/E Ratios
Generally speaking the rate of earnings growth has a profound impact on a company's P/E multiple. When earnings grow, the 'E' increases, over time. That means even if the current P/E is high, it will reduce over time if the share price stays flat. Then, a lower P/E should attract more buyers, pushing the share price up.
Hunter Douglas increased earnings per share by 5.9% last year. And it has bolstered its earnings per share by 18% per year over the last five years.
Remember: P/E Ratios Don't Consider The Balance Sheet
It's important to note that the P/E ratio considers the market capitalization, not the enterprise value. That means it doesn't take debt or cash into account. In theory, a company can lower its future P/E ratio by using cash or debt to invest in growth.
Such spending might be good or bad, overall, but the key point here is that you need to look at debt to understand the P/E ratio in context.
So What Does Hunter Douglas's Balance Sheet Tell Us?
Hunter Douglas has net debt equal to 35% of its market cap. You'd want to be aware of this fact, but it doesn't bother us.
The Bottom Line On Hunter Douglas's P/E Ratio
Hunter Douglas has a P/E of 5.9. That's below the average in the NL market, which is 15.4. The company hasn't stretched its balance sheet, and earnings are improving. If you believe growth will continue - or even increase - then the low P/E may signify opportunity. Given Hunter Douglas's P/E ratio has declined from 8.6 to 5.9 in the last month, we know for sure that the market is more worried about the business today, than it was back then. For those who prefer to invest with the flow of momentum, that might be a bad sign, but for deep value investors this stock might justify some research.
When the market is wrong about a stock, it gives savvy investors an opportunity. If the reality for a company is not as bad as the P/E ratio indicates, then the share price should increase as the market realizes this. We don't have analyst forecasts, but you could get a better understanding of its growth by checking out this more detailed historical graph of earnings, revenue and cash flow.
But note: Hunter Douglas may not be the best stock to buy. So take a peek at this free list of interesting companies with strong recent earnings growth (and a P/E ratio below 20).
If you spot an error that warrants correction, please contact the editor at editorial-team@simplywallst.com. This article by Simply Wall St is general in nature. It does not constitute a recommendation to buy or sell any stock, and does not take account of your objectives, or your financial situation. Simply Wall St has no position in the stocks mentioned.
We aim to bring you long-term focused research analysis driven by fundamental data. Note that our analysis may not factor in the latest price-sensitive company announcements or qualitative material. Thank you for reading.
