
 Yahoo Finance
 Is Huntington Bancshares Incorporated's (NASDAQ:HBAN) P/E Ratio Really That Good?

Today, we'll introduce the concept of the P/E ratio for those who are learning about investing. We'll look at Huntington Bancshares Incorporated's (NASDAQ:HBAN) P/E ratio and reflect on what it tells us about the company's share price. Based on the last twelve months, Huntington Bancshares's P/E ratio is 11.16. That corresponds to an earnings yield of approximately 9.0%.
View our latest analysis for Huntington Bancshares
How Do You Calculate Huntington Bancshares's P/E Ratio?
The formula for P/E is:
Price to Earnings Ratio = Share Price ÷ Earnings per Share (EPS)
Or for Huntington Bancshares:
P/E of 11.16 = USD14.46 ÷ USD1.30 (Based on the year to September 2019.)
Is A High Price-to-Earnings Ratio Good?
The higher the P/E ratio, the higher the price tag of a business, relative to its trailing earnings. All else being equal, it's better to pay a low price -- but as Warren Buffett said, 'It's far better to buy a wonderful company at a fair price than a fair company at a wonderful price'.
Does Huntington Bancshares Have A Relatively High Or Low P/E For Its Industry?
The P/E ratio essentially measures market expectations of a company. If you look at the image below, you can see Huntington Bancshares has a lower P/E than the average (12.7) in the banks industry classification.
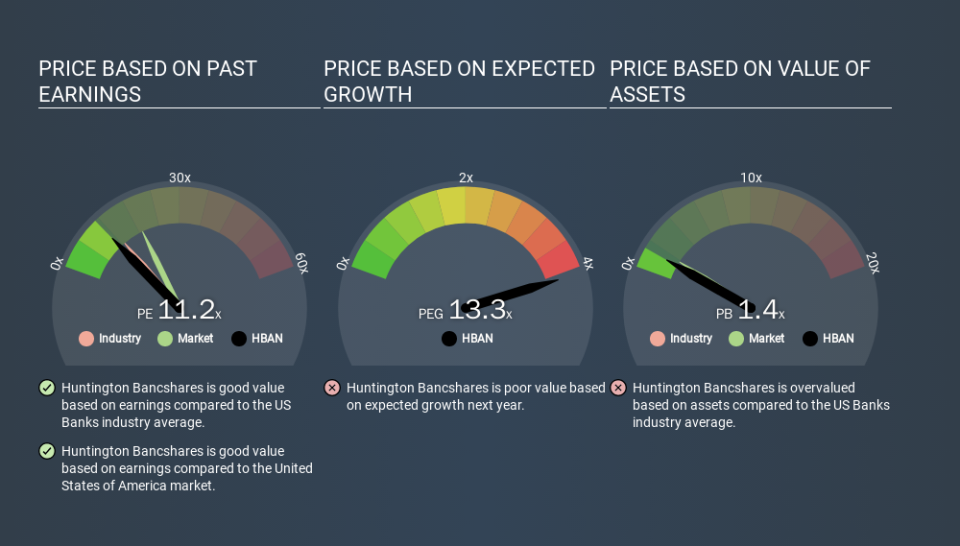
This suggests that market participants think Huntington Bancshares will underperform other companies in its industry. Many investors like to buy stocks when the market is pessimistic about their prospects. It is arguably worth checking if insiders are buying shares, because that might imply they believe the stock is undervalued.
How Growth Rates Impact P/E Ratios
Generally speaking the rate of earnings growth has a profound impact on a company's P/E multiple. That's because companies that grow earnings per share quickly will rapidly increase the 'E' in the equation. And in that case, the P/E ratio itself will drop rather quickly. So while a stock may look expensive based on past earnings, it could be cheap based on future earnings.
Huntington Bancshares maintained roughly steady earnings over the last twelve months. But over the longer term (5 years) earnings per share have increased by 12%.
Remember: P/E Ratios Don't Consider The Balance Sheet
One drawback of using a P/E ratio is that it considers market capitalization, but not the balance sheet. That means it doesn't take debt or cash into account. The exact same company would hypothetically deserve a higher P/E ratio if it had a strong balance sheet, than if it had a weak one with lots of debt, because a cashed up company can spend on growth.
While growth expenditure doesn't always pay off, the point is that it is a good option to have; but one that the P/E ratio ignores.
So What Does Huntington Bancshares's Balance Sheet Tell Us?
Huntington Bancshares has net debt worth 65% of its market capitalization. This is enough debt that you'd have to make some adjustments before using the P/E ratio to compare it to a company with net cash.
The Bottom Line On Huntington Bancshares's P/E Ratio
Huntington Bancshares has a P/E of 11.2. That's below the average in the US market, which is 18.9. Given meaningful debt, and a lack of recent growth, the market looks to be extrapolating this recent performance; reflecting low expectations for the future.
Investors should be looking to buy stocks that the market is wrong about. If it is underestimating a company, investors can make money by buying and holding the shares until the market corrects itself. So this free visual report on analyst forecasts could hold the key to an excellent investment decision.
You might be able to find a better buy than Huntington Bancshares. If you want a selection of possible winners, check out this free list of interesting companies that trade on a P/E below 20 (but have proven they can grow earnings).
If you spot an error that warrants correction, please contact the editor at editorial-team@simplywallst.com. This article by Simply Wall St is general in nature. It does not constitute a recommendation to buy or sell any stock, and does not take account of your objectives, or your financial situation. Simply Wall St has no position in the stocks mentioned.
We aim to bring you long-term focused research analysis driven by fundamental data. Note that our analysis may not factor in the latest price-sensitive company announcements or qualitative material. Thank you for reading.
