
 Yahoo Finance
 Huntington (HBAN) Q3 Earnings Miss Estimates, Revenues Beat
Huntington Bancshares Incorporated HBAN has reported third-quarter 2021 adjusted earnings per share of 35 cents, missing the Zacks Consensus Estimate of 36 cents. This excluded TCF Financial Corporation’s acquisition-related adjustments.
Full-quarter benefit from the TCF acquisition along with fee income growth, particularly in wealth management, capital markets, and card and payments processing, drove the top line. Improvement in deposits and a provision benefit were other positives. However, results were adversely impacted by elevated expenses and the TCF Financial acquisition-related expenses. Declining capital ratios created a headwind.
The company reported a net income of $377million in the quarter compared with $303 million in the year-ago quarter.
Revenues Rise, Expenses Escalate
Total revenues (FTE) climbed 36% year over year to $1.7 billion in the third quarter. Also, the top line marginally surpassed the consensus estimate.
Net interest income (FTE basis) was $1.16 million, up 42% from the prior-year quarter. The upside resulted from an increase in average earning assets, partly offset by a lower net interest margin (NIM), which contracted 6 basis points (bps) to 2.90%.
Non-interest income climbed 24% year over year to $535 million. The upside mainly stemmed from increased service charges on deposit accounts, card and payment processing, leasing revenues, and capital market fees.
Non-interest expenses flared up 81% on a year-over-year basis to $1.29 billion. This was chiefly due to higher professional services costs, outside data processing and other service costs, and marketing expenses.
The efficiency ratio was 74.90%, up from the prior-year quarter’s 56.1%. A rise in the ratio indicates a fall in profitability.
As of Sep 30, 2021, average loans and leases at Huntington increased 26% on a sequential basis to $109.9 billion. Average total deposits increased 26% from the prior quarter to $142.3 billion.
Credit Quality: A Mixed Bag
Net charge-offs were $55 million or an annualized 0.20% of average total loans in the reported quarter, down from $113 million or an annualized 0.56% recorded in the prior year. In the third quarter, the company reported a credit provision benefit of $62 million compared with a provision of $177 million in the prior-year quarter.
The quarter-end allowance for credit losses rose 17.4% to $2.21 billion. In addition, total non-performing assets totaled $893 million as of Sep 30, 2021, up 48.3%.
Capital Ratios Decline
Common equity tier 1 risk-based capital ratio and regulatory Tier 1 risk-based capital ratio were 9.57% and 11.35%, respectively, compared with 9.89% and 12.37% reported in the year-ago quarter. Tangible common equity to tangible assets ratio was 6.96%, down from 7.27% as of Sep 30, 2020.
Capital Deployment
The company has repurchased $300 million of common stock through Sep 30 and has $300 million remaining under the current authorization.
Our Viewpoint
Huntington put up a decent performance in the September-end quarter. Though the company displayed continued efforts in increasing loan and deposit balances, margin pressure and elevated expenses remain concerning. However, improvement in credit metrics on lower provisions due to the recovering economy is a tailwind.
Currently, Huntington carries a Zacks Rank #3 (Hold). You can see the complete list of today’s Zacks #1 Rank (Strong Buy) stocks here.
Huntington Bancshares Incorporated Price, Consensus and EPS Surprise
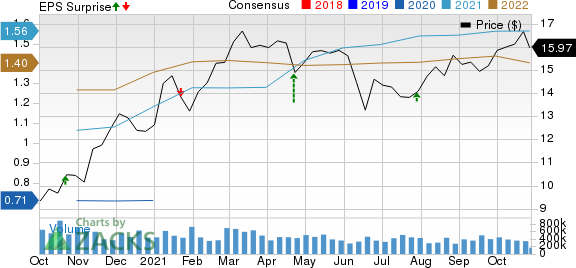
Huntington Bancshares Incorporated price-consensus-eps-surprise-chart | Huntington Bancshares Incorporated Quote
Performance of Other Banks
BancorpSouth Bank BXS delivered net operating earnings of 68 cents per share that beat the Zacks Consensus Estimate of 67 cents. However, the bottom line compares unfavorably with the 69 cents reported in the year-ago quarter.
Bank of Hawaii Corporation BOH reported third-quarter 2021 earnings per share of $1.52, surpassing the Zacks Consensus Estimate of $1.34. Also, the bottom line compares favorably with the 95 cents reported in the prior-year quarter.
Bank OZK’s OZK third-quarter 2021 earnings per share of $1 surpassed the Zacks Consensus Estimate of 97 cents. The bottom line reflects growth of 19% from the year-earlier quarter’s number.
Want the latest recommendations from Zacks Investment Research? Today, you can download 7 Best Stocks for the Next 30 Days. Click to get this free report
Huntington Bancshares Incorporated (HBAN) : Free Stock Analysis Report
BancorpSouth Bank (BXS) : Free Stock Analysis Report
Bank of Hawaii Corporation (BOH) : Free Stock Analysis Report
Bank OZK (OZK) : Free Stock Analysis Report
To read this article on Zacks.com click here.
Zacks Investment Research
