
 Yahoo Finance
 IBU-tec advanced materials (ETR:IBU) investors are up 47% in the past week, but earnings have declined over the last three years
By buying an index fund, you can roughly match the market return with ease. But many of us dare to dream of bigger returns, and build a portfolio ourselves. Just take a look at IBU-tec advanced materials AG (ETR:IBU), which is up 53%, over three years, soundly beating the market decline of 8.5% (not including dividends).
Since the stock has added €36m to its market cap in the past week alone, let's see if underlying performance has been driving long-term returns.
Check out our latest analysis for IBU-tec advanced materials
While markets are a powerful pricing mechanism, share prices reflect investor sentiment, not just underlying business performance. One imperfect but simple way to consider how the market perception of a company has shifted is to compare the change in the earnings per share (EPS) with the share price movement.
Over the last three years, IBU-tec advanced materials failed to grow earnings per share, which fell 18% (annualized).
Thus, it seems unlikely that the market is focussed on EPS growth at the moment. Since the change in EPS doesn't seem to correlate with the change in share price, it's worth taking a look at other metrics.
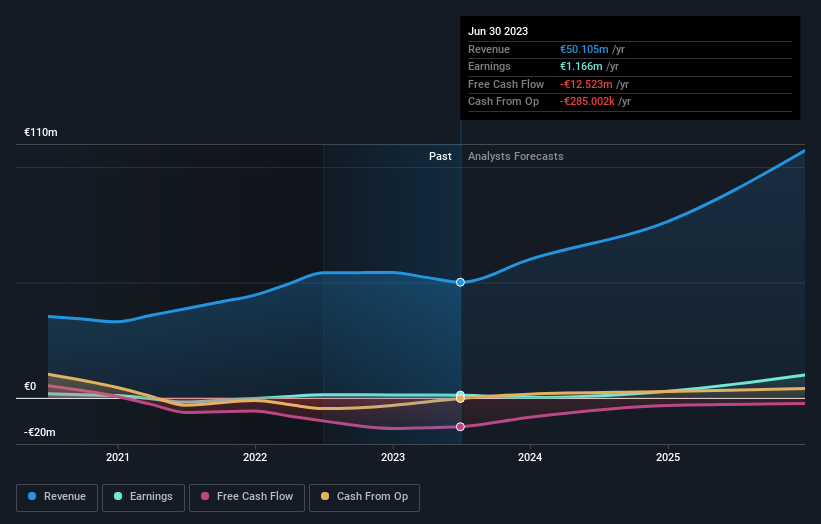
Languishing at just 0.2%, we doubt the dividend is doing much to prop up the share price. It may well be that IBU-tec advanced materials revenue growth rate of 18% over three years has convinced shareholders to believe in a brighter future. In that case, the company may be sacrificing current earnings per share to drive growth, and maybe shareholder's faith in better days ahead will be rewarded.
You can see below how earnings and revenue have changed over time (discover the exact values by clicking on the image).
If you are thinking of buying or selling IBU-tec advanced materials stock, you should check out this FREE detailed report on its balance sheet.
What About Dividends?
It is important to consider the total shareholder return, as well as the share price return, for any given stock. The TSR is a return calculation that accounts for the value of cash dividends (assuming that any dividend received was reinvested) and the calculated value of any discounted capital raisings and spin-offs. Arguably, the TSR gives a more comprehensive picture of the return generated by a stock. We note that for IBU-tec advanced materials the TSR over the last 3 years was 61%, which is better than the share price return mentioned above. And there's no prize for guessing that the dividend payments largely explain the divergence!
A Different Perspective
While the broader market gained around 9.8% in the last year, IBU-tec advanced materials shareholders lost 6.4% (even including dividends). However, keep in mind that even the best stocks will sometimes underperform the market over a twelve month period. On the bright side, long term shareholders have made money, with a gain of 9% per year over half a decade. If the fundamental data continues to indicate long term sustainable growth, the current sell-off could be an opportunity worth considering. I find it very interesting to look at share price over the long term as a proxy for business performance. But to truly gain insight, we need to consider other information, too. To that end, you should be aware of the 2 warning signs we've spotted with IBU-tec advanced materials .
If you are like me, then you will not want to miss this free list of growing companies that insiders are buying.
Please note, the market returns quoted in this article reflect the market weighted average returns of stocks that currently trade on German exchanges.
Have feedback on this article? Concerned about the content? Get in touch with us directly. Alternatively, email editorial-team (at) simplywallst.com.
This article by Simply Wall St is general in nature. We provide commentary based on historical data and analyst forecasts only using an unbiased methodology and our articles are not intended to be financial advice. It does not constitute a recommendation to buy or sell any stock, and does not take account of your objectives, or your financial situation. We aim to bring you long-term focused analysis driven by fundamental data. Note that our analysis may not factor in the latest price-sensitive company announcements or qualitative material. Simply Wall St has no position in any stocks mentioned.
