
 Yahoo Finance
 Iconix Brand Group, Inc. Just Reported And Analysts Have Been Cutting Their Estimates

There's been a major selloff in Iconix Brand Group, Inc. (NASDAQ:ICON) shares in the week since it released its third-quarter report, with the stock down 23% to US$1.81. Results look to have been somewhat negative - revenue fell 3.0% short of analyst estimates at US$35m, although losses were a relative bright spot. The per-share loss was US$3.07, 1295% smaller than analysts were expecting prior to the result. Analysts typically update their forecasts at each earnings report, and we can judge from their estimates whether their view of the company has changed or if there are any new concerns to be aware of. Readers will be glad to know we've aggregated the latest forecasts to see whether analysts have changed their mind on Iconix Brand Group after the latest results.
Check out our latest analysis for Iconix Brand Group
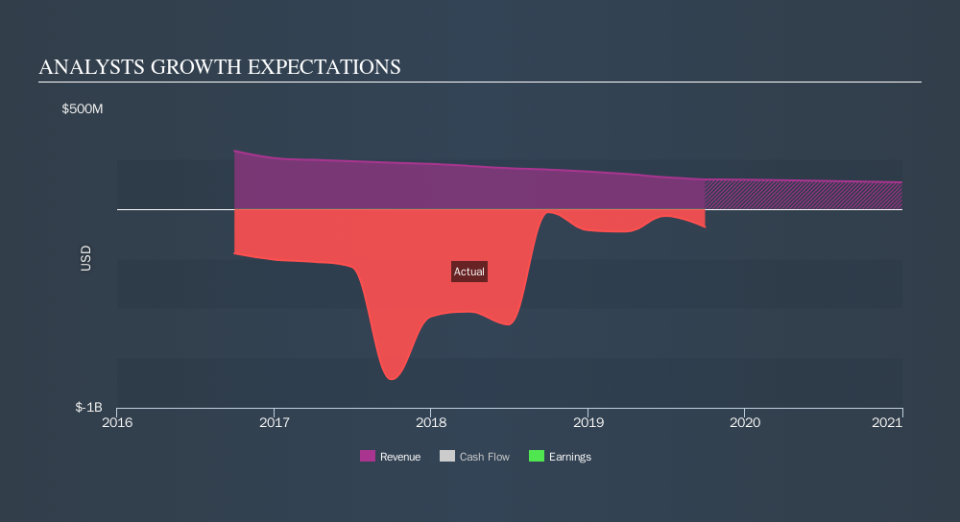
Following the recent earnings report, the consensus fromlone analyst covering Iconix Brand Group expects revenues of US$133.0m in 2020, implying a considerable 10% decline in sales compared to the last 12 months. Iconix Brand Group is also expected to turn profitable, with earnings of US$0.48 per share. Before this earnings report, analysts had been forecasting revenues of US$158.2m and earnings per share (EPS) of US$1.70 in 2020. It looks like analyst sentiment has declined substantially in the aftermath of these results, with a substantial drop in revenue estimates and a pretty serious reduction to consensus earnings per share numbers as well.
The consensus price target fell 20% to US$8.00, with the weaker earnings outlook clearly leading analyst valuation estimates.
One way to get more context on these forecasts is to look at how they compare to both past performance, and how other companies in the same industry are performing. Over the past five years, revenues have declined around 19% annually. On the bright side, analysts expect the decline to level off somewhat, with the forecast for a 10% decline in revenue next year. Compare this against analyst estimates for companies in the wider market, which suggest that revenues (in aggregate) are expected to decline 7.0% next year. So while it's not great to see that analysts are expecting a decline, at least Iconix Brand Group is forecast to shrink at a slower rate than the wider market.
The Bottom Line
The biggest highlight of the new consensus is that analysts have reduced their earnings per share estimates, suggesting business headwinds could lay ahead for Iconix Brand Group. On the negative side, they also downgraded their revenue estimates, and forecasts imply revenues will perform worse than the wider market. Analysts also downgraded their price target, suggesting that the latest news has led analysts to become more pessimistic about the intrinsic value of the business.
With that in mind, we wouldn't be too quick to come to a conclusion on Iconix Brand Group. Long-term earnings power is much more important than next year's profits. We have analyst estimates for Iconix Brand Group going out as far as 2020, and you can see them free on our platform here.
You can also view our analysis of Iconix Brand Group's balance sheet, and whether we think Iconix Brand Group is carrying too much debt, for free on our platform here.
We aim to bring you long-term focused research analysis driven by fundamental data. Note that our analysis may not factor in the latest price-sensitive company announcements or qualitative material.
If you spot an error that warrants correction, please contact the editor at editorial-team@simplywallst.com. This article by Simply Wall St is general in nature. It does not constitute a recommendation to buy or sell any stock, and does not take account of your objectives, or your financial situation. Simply Wall St has no position in the stocks mentioned. Thank you for reading.
