
 Yahoo Finance
 Can You Imagine How DO & CO's (VIE:DOC) Shareholders Feel About The 81% Share Price Increase?

When we invest, we're generally looking for stocks that outperform the market average. And the truth is, you can make significant gains if you buy good quality businesses at the right price. For example, the DO & CO Aktiengesellschaft (VIE:DOC) share price is up 81% in the last 5 years, clearly besting the market return of around 44% (ignoring dividends). On the other hand, the more recent gains haven't been so impressive, with shareholders gaining just 8.3% , including dividends .
See our latest analysis for DO & CO
There is no denying that markets are sometimes efficient, but prices do not always reflect underlying business performance. One flawed but reasonable way to assess how sentiment around a company has changed is to compare the earnings per share (EPS) with the share price.
DO & CO's earnings per share are down 2.4% per year, despite strong share price performance over five years.
So it's hard to argue that the earnings per share are the best metric to judge the company, as it may not be optimized for profits at this point. Since the change in EPS doesn't seem to correlate with the change in share price, it's worth taking a look at other metrics.
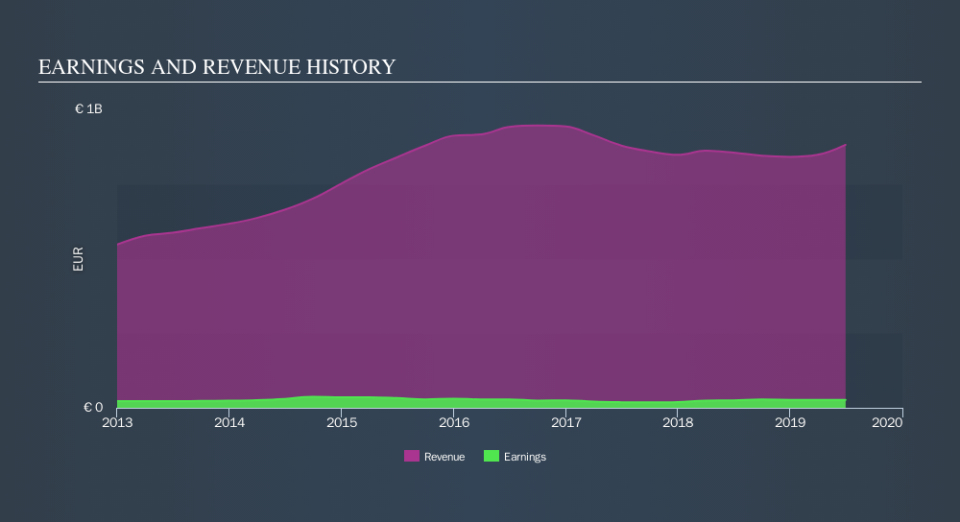
We doubt the modest 1.0% dividend yield is attracting many buyers to the stock. We are not particularly impressed by the annual compound revenue growth of 2.4% over five years. So why is the share price up? It's not immediately obvious to us, but a closer look at the company's progress over time might yield answers.
The company's revenue and earnings (over time) are depicted in the image below (click to see the exact numbers).
If you are thinking of buying or selling DO & CO stock, you should check out this FREE detailed report on its balance sheet.
What About Dividends?
It is important to consider the total shareholder return, as well as the share price return, for any given stock. The TSR is a return calculation that accounts for the value of cash dividends (assuming that any dividend received was reinvested) and the calculated value of any discounted capital raisings and spin-offs. It's fair to say that the TSR gives a more complete picture for stocks that pay a dividend. As it happens, DO & CO's TSR for the last 5 years was 94%, which exceeds the share price return mentioned earlier. And there's no prize for guessing that the dividend payments largely explain the divergence!
A Different Perspective
DO & CO shareholders have received returns of 8.3% over twelve months (even including dividends) , which isn't far from the general market return. We should note here that the five-year TSR is more impressive, at 14% per year. More recently, the share price growth has slowed. But it has to be said the overall picture is one of good long term and short term performance. Arguably that makes DO & CO a stock worth watching. Is DO & CO cheap compared to other companies? These 3 valuation measures might help you decide.
If you would prefer to check out another company -- one with potentially superior financials -- then do not miss this free list of companies that have proven they can grow earnings.
Please note, the market returns quoted in this article reflect the market weighted average returns of stocks that currently trade on AT exchanges.
We aim to bring you long-term focused research analysis driven by fundamental data. Note that our analysis may not factor in the latest price-sensitive company announcements or qualitative material.
If you spot an error that warrants correction, please contact the editor at editorial-team@simplywallst.com. This article by Simply Wall St is general in nature. It does not constitute a recommendation to buy or sell any stock, and does not take account of your objectives, or your financial situation. Simply Wall St has no position in the stocks mentioned. Thank you for reading.
