
 Yahoo Finance
 Imagine Owning Deceuninck (EBR:DECB) While The Price Tanked 50%
As an investor its worth striving to ensure your overall portfolio beats the market average. But if you try your hand at stock picking, your risk returning less than the market. Unfortunately, that's been the case for longer term Deceuninck NV (EBR:DECB) shareholders, since the share price is down 50% in the last three years, falling well short of the market decline of around 31%. And over the last year the share price fell 38%, so we doubt many shareholders are delighted. Furthermore, it's down 30% in about a quarter. That's not much fun for holders. However, one could argue that the price has been influenced by the general market, which is down 25% in the same timeframe.
See our latest analysis for Deceuninck
To paraphrase Benjamin Graham: Over the short term the market is a voting machine, but over the long term it's a weighing machine. One way to examine how market sentiment has changed over time is to look at the interaction between a company's share price and its earnings per share (EPS).
Deceuninck saw its share price decline over the three years in which its EPS also dropped, falling to a loss. Due to the loss, it's not easy to use EPS as a reliable guide to the business. However, we can say we'd expect to see a falling share price in this scenario.
The graphic below depicts how EPS has changed over time (unveil the exact values by clicking on the image).
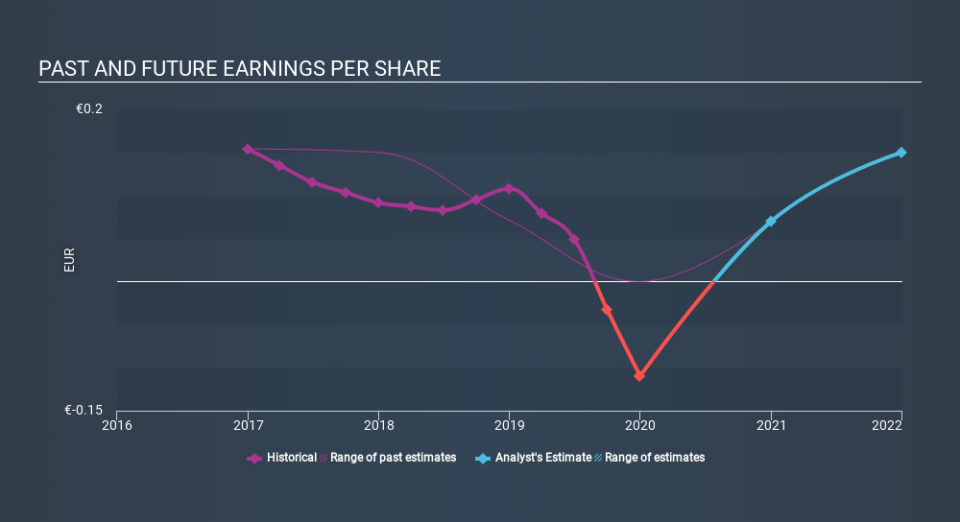
Before buying or selling a stock, we always recommend a close examination of historic growth trends, available here.
What about the Total Shareholder Return (TSR)?
We'd be remiss not to mention the difference between Deceuninck's total shareholder return (TSR) and its share price return. Arguably the TSR is a more complete return calculation because it accounts for the value of dividends (as if they were reinvested), along with the hypothetical value of any discounted capital that have been offered to shareholders. Dividends have been really beneficial for Deceuninck shareholders, and that cash payout explains why its total shareholder loss of 49%, over the last 3 years, isn't as bad as the share price return.
A Different Perspective
We regret to report that Deceuninck shareholders are down 38% for the year (even including dividends) . Unfortunately, that's worse than the broader market decline of 26%. Having said that, it's inevitable that some stocks will be oversold in a falling market. The key is to keep your eyes on the fundamental developments. Unfortunately, last year's performance may indicate unresolved challenges, given that it was worse than the annualised loss of 5.6% over the last half decade. Generally speaking long term share price weakness can be a bad sign, though contrarian investors might want to research the stock in hope of a turnaround. It's always interesting to track share price performance over the longer term. But to understand Deceuninck better, we need to consider many other factors. Even so, be aware that Deceuninck is showing 3 warning signs in our investment analysis , and 2 of those are potentially serious...
If you would prefer to check out another company -- one with potentially superior financials -- then do not miss this free list of companies that have proven they can grow earnings.
Please note, the market returns quoted in this article reflect the market weighted average returns of stocks that currently trade on BE exchanges.
If you spot an error that warrants correction, please contact the editor at editorial-team@simplywallst.com. This article by Simply Wall St is general in nature. It does not constitute a recommendation to buy or sell any stock, and does not take account of your objectives, or your financial situation. Simply Wall St has no position in the stocks mentioned.
We aim to bring you long-term focused research analysis driven by fundamental data. Note that our analysis may not factor in the latest price-sensitive company announcements or qualitative material. Thank you for reading.
