
 Yahoo Finance
 Imagine Owning iStar (NYSE:STAR) And Wondering If The 44% Share Price Slide Is Justified

The main aim of stock picking is to find the market-beating stocks. But in any portfolio, there will be mixed results between individual stocks. So we wouldn’t blame long term iStar Inc. (NYSE:STAR) shareholders for doubting their decision to hold, with the stock down 44% over a half decade. Furthermore, it’s down 18% in about a quarter. That’s not much fun for holders. We note that the company has reported results fairly recently; and the market is hardly delighted. You can check out the latest numbers in our company report.
See our latest analysis for iStar
Because iStar is loss-making, we think the market is probably more focussed on revenue and revenue growth, at least for now. Shareholders of unprofitable companies usually expect strong revenue growth. As you can imagine, fast revenue growth, when maintained, often leads to fast profit growth.
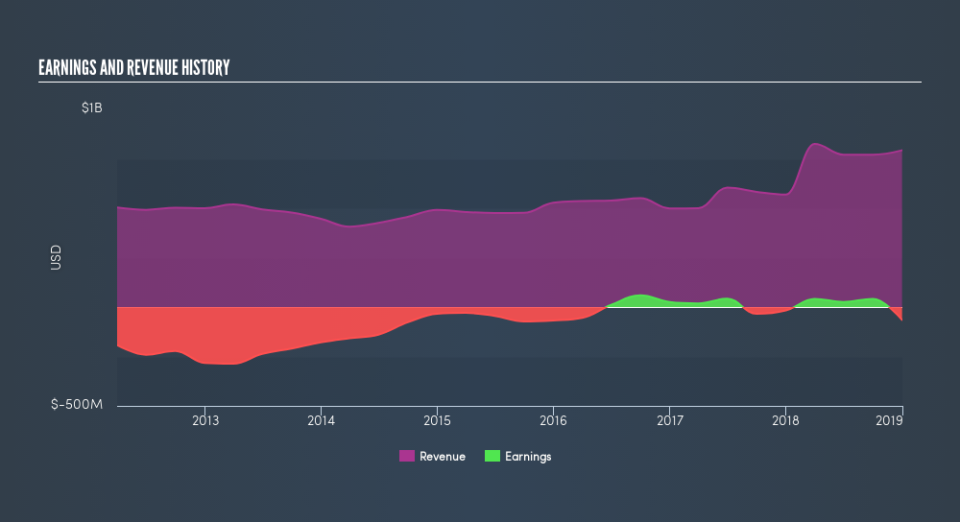
In the last half decade, iStar saw its revenue increase by 13% per year. That’s a pretty good rate for a long time period. We doubt many shareholders are ok with the fact the share price has fallen 11% each year for half a decade. Those who bought back then clearly believed in stronger growth – and maybe even profits. There is always a big risk of losing money yourself when you buy shares in a company that loses money.
The graphic below shows how revenue and earnings have changed as management guided the business forward. If you want to see cashflow, you can click on the chart.
If you are thinking of buying or selling iStar stock, you should check out this FREE detailed report on its balance sheet.
What about the Total Shareholder Return (TSR)?
Investors should note that there’s a difference between iStar’s total shareholder return (TSR) and its share price change, which we’ve covered above. Arguably the TSR is a more complete return calculation because it accounts for the value of dividends (as if they were reinvested), along with the hypothetical value of any discounted capital that have been offered to shareholders. Its history of dividend payouts mean that iStar’s TSR, which was a 42% drop over the last 5 years, was not as bad as the share price return.
A Different Perspective
Investors in iStar had a tough year, with a total loss of 14% (including dividends), against a market gain of about 1.4%. However, keep in mind that even the best stocks will sometimes underperform the market over a twelve month period. Unfortunately, last year’s performance may indicate unresolved challenges, given that it was worse than the annualised loss of 10% over the last half decade. Generally speaking long term share price weakness can be a bad sign, though contrarian investors might want to research the stock in hope of a turnaround. Keeping this in mind, a solid next step might be to take a look at iStar’s dividend track record. This free interactive graph is a great place to start.
Of course iStar may not be the best stock to buy. So you may wish to see this free collection of growth stocks.
Please note, the market returns quoted in this article reflect the market weighted average returns of stocks that currently trade on US exchanges.
We aim to bring you long-term focused research analysis driven by fundamental data. Note that our analysis may not factor in the latest price-sensitive company announcements or qualitative material.
If you spot an error that warrants correction, please contact the editor at editorial-team@simplywallst.com. This article by Simply Wall St is general in nature. It does not constitute a recommendation to buy or sell any stock, and does not take account of your objectives, or your financial situation. Simply Wall St has no position in the stocks mentioned. Thank you for reading.
