
 Yahoo Finance
 Imagine Owning United Carpets Group (LON:UCG) And Wondering If The 46% Share Price Slide Is Justified

Many investors define successful investing as beating the market average over the long term. But the risk of stock picking is that you will likely buy under-performing companies. Unfortunately, that's been the case for longer term United Carpets Group plc (LON:UCG) shareholders, since the share price is down 46% in the last three years, falling well short of the market return of around 20%. And more recent buyers are having a tough time too, with a drop of 28% in the last year. It's up 3.0% in the last seven days.
View our latest analysis for United Carpets Group
While markets are a powerful pricing mechanism, share prices reflect investor sentiment, not just underlying business performance. One flawed but reasonable way to assess how sentiment around a company has changed is to compare the earnings per share (EPS) with the share price.
United Carpets Group saw its EPS decline at a compound rate of 30% per year, over the last three years. In comparison the 19% compound annual share price decline isn't as bad as the EPS drop-off. This suggests that the market retains some optimism around long term earnings stability, despite past EPS declines.
The graphic below depicts how EPS has changed over time (unveil the exact values by clicking on the image).
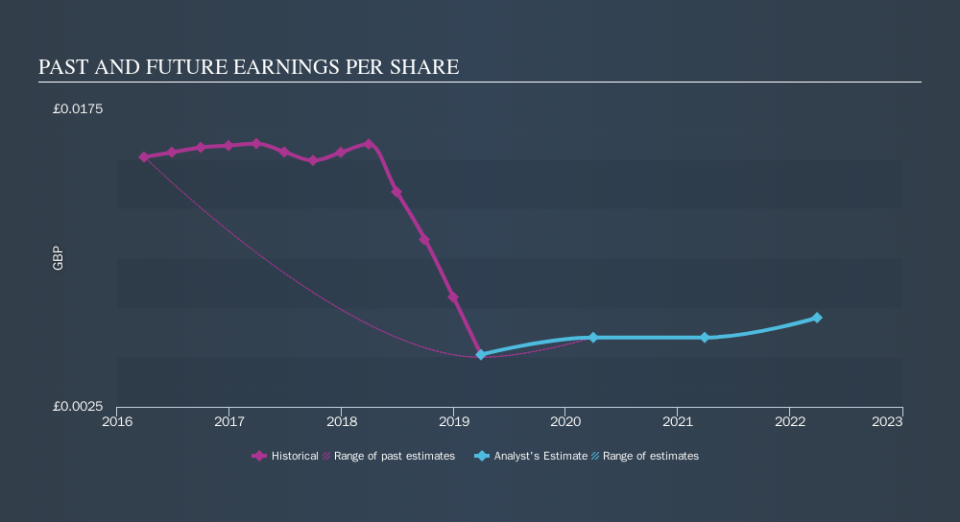
Before buying or selling a stock, we always recommend a close examination of historic growth trends, available here..
What About Dividends?
It is important to consider the total shareholder return, as well as the share price return, for any given stock. Whereas the share price return only reflects the change in the share price, the TSR includes the value of dividends (assuming they were reinvested) and the benefit of any discounted capital raising or spin-off. Arguably, the TSR gives a more comprehensive picture of the return generated by a stock. As it happens, United Carpets Group's TSR for the last 3 years was -31%, which exceeds the share price return mentioned earlier. The dividends paid by the company have thusly boosted the total shareholder return.
A Different Perspective
United Carpets Group shareholders are down 22% for the year (even including dividends) , but the market itself is up 8.8%. However, keep in mind that even the best stocks will sometimes underperform the market over a twelve month period. On the bright side, long term shareholders have made money, with a gain of 1.0% per year over half a decade. If the fundamental data continues to indicate long term sustainable growth, the current sell-off could be an opportunity worth considering. Importantly, we haven't analysed United Carpets Group's dividend history. This free visual report on its dividends is a must-read if you're thinking of buying.
For those who like to find winning investments this free list of growing companies with recent insider purchasing, could be just the ticket.
Please note, the market returns quoted in this article reflect the market weighted average returns of stocks that currently trade on GB exchanges.
We aim to bring you long-term focused research analysis driven by fundamental data. Note that our analysis may not factor in the latest price-sensitive company announcements or qualitative material.
If you spot an error that warrants correction, please contact the editor at editorial-team@simplywallst.com. This article by Simply Wall St is general in nature. It does not constitute a recommendation to buy or sell any stock, and does not take account of your objectives, or your financial situation. Simply Wall St has no position in the stocks mentioned. Thank you for reading.
