
 Yahoo Finance
 Can You Imagine How Renew Holdings's (LON:RNWH) Shareholders Feel About The 70% Share Price Increase?

Want to participate in a research study? Help shape the future of investing tools and earn a $60 gift card!
Stock pickers are generally looking for stocks that will outperform the broader market. Buying under-rated businesses is one path to excess returns. For example, long term Renew Holdings plc (LON:RNWH) shareholders have enjoyed a 70% share price rise over the last half decade, well in excess of the market return of around 3.3% (not including dividends). On the other hand, the more recent gains haven't been so impressive, with shareholders gaining just 9.4%, including dividends.
Check out our latest analysis for Renew Holdings
In his essay The Superinvestors of Graham-and-Doddsville Warren Buffett described how share prices do not always rationally reflect the value of a business. By comparing earnings per share (EPS) and share price changes over time, we can get a feel for how investor attitudes to a company have morphed over time.
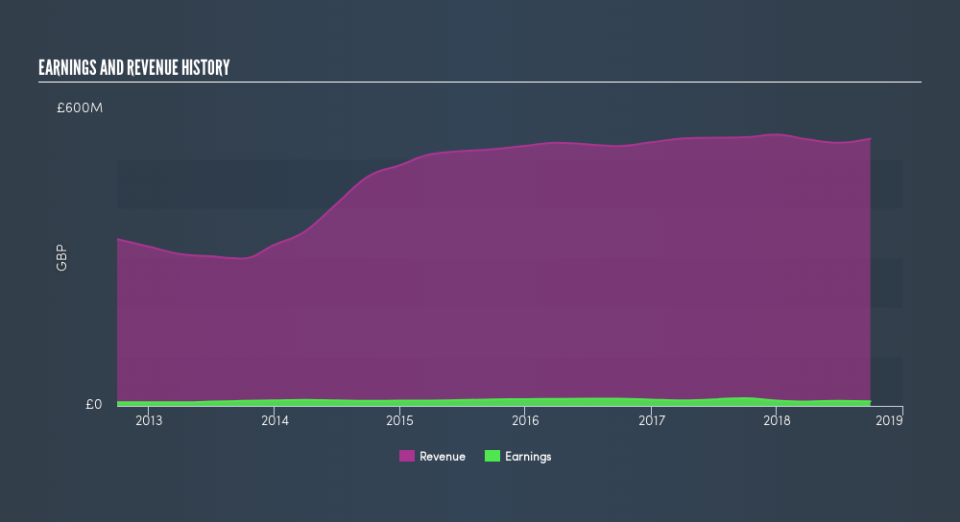
During five years of share price growth, Renew Holdings actually saw its EPS drop 3.9% per year. So it's hard to argue that the earnings per share are the best metric to judge the company, as it may not be optimized for profits at this point. Since the change in EPS doesn't seem to correlate with the change in share price, it's worth taking a look at other metrics.
In contrast revenue growth of 8.4% per year is probably viewed as evidence that Renew Holdings is growing, a real positive. It's quite possible that management are prioritizing revenue growth over EPS growth at the moment.
You can see how revenue and earnings have changed over time in the image below, (click on the chart to see cashflow).
Take a more thorough look at Renew Holdings's financial health with this free report on its balance sheet.
What About Dividends?
As well as measuring the share price return, investors should also consider the total shareholder return (TSR). Whereas the share price return only reflects the change in the share price, the TSR includes the value of dividends (assuming they were reinvested) and the benefit of any discounted capital raising or spin-off. Arguably, the TSR gives a more comprehensive picture of the return generated by a stock. As it happens, Renew Holdings's TSR for the last 5 years was 89%, which exceeds the share price return mentioned earlier. And there's no prize for guessing that the dividend payments largely explain the divergence!
A Different Perspective
It's good to see that Renew Holdings has rewarded shareholders with a total shareholder return of 9.4% in the last twelve months. That's including the dividend. Having said that, the five-year TSR of 14% a year, is even better. The pessimistic view would be that be that the stock has its best days behind it, but on the other hand the price might simply be moderating while the business itself continues to execute. Before forming an opinion on Renew Holdings you might want to consider these 3 valuation metrics.
We will like Renew Holdings better if we see some big insider buys. While we wait, check out this free list of growing companies with considerable, recent, insider buying.
Please note, the market returns quoted in this article reflect the market weighted average returns of stocks that currently trade on GB exchanges.
We aim to bring you long-term focused research analysis driven by fundamental data. Note that our analysis may not factor in the latest price-sensitive company announcements or qualitative material.
If you spot an error that warrants correction, please contact the editor at editorial-team@simplywallst.com. This article by Simply Wall St is general in nature. It does not constitute a recommendation to buy or sell any stock, and does not take account of your objectives, or your financial situation. Simply Wall St has no position in the stocks mentioned. Thank you for reading.
