
 Yahoo Finance
 Can You Imagine How TomTom’s (AMS:TOM2) Shareholders Feel About The 64% Share Price Increase?

Generally speaking the aim of active stock picking is to find companies that provide returns that are superior to the market average. Buying under-rated businesses is one path to excess returns. To wit, the TomTom share price has climbed 64% in five years, easily topping the market return of 29% (ignoring dividends).
See our latest analysis for TomTom
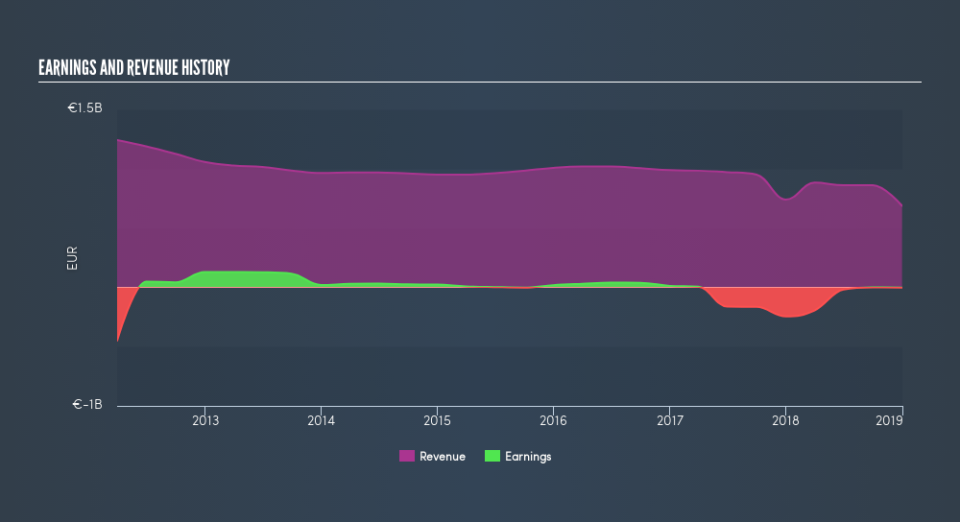
Given that TomTom didn’t make a profit in the last twelve months, we’ll focus on revenue growth to form a quick view of its business development. When a company doesn’t make profits, we’d generally expect to see good revenue growth. That’s because it’s hard to be confident a company will be sustainable if revenue growth is negligible, and it never makes a profit.
Over the last half decade TomTom’s revenue has actually been trending down at about 3.6% per year. Despite the lack of revenue growth, the stock has returned a respectable 10%, compound, over that time. To us that suggests that there probably isn’t a lot of correlation between the past revenue performance and the share price, but a closer look at analyst forecasts and the bottom line may well explain a lot.
The graphic below shows how revenue and earnings have changed as management guided the business forward. If you want to see cashflow, you can click on the chart.
Take a more thorough look at TomTom’s financial health with this free report on its balance sheet.
A Different Perspective
TomTom shareholders are down 2.7% for the year, but the market itself is up 6.6%. However, keep in mind that even the best stocks will sometimes underperform the market over a twelve month period. Longer term investors wouldn’t be so upset, since they would have made 10%, each year, over five years. It could be that the recent sell-off is an opportunity, so it may be worth checking the fundamental data for signs of a long term growth trend. You could get a better understanding of TomTom’s growth by checking out this more detailed historical graph of earnings, revenue and cash flow.
We will like TomTom better if we see some big insider buys. While we wait, check out this free list of growing companies with considerable, recent, insider buying.
Please note, the market returns quoted in this article reflect the market weighted average returns of stocks that currently trade on NL exchanges.
We aim to bring you long-term focused research analysis driven by fundamental data. Note that our analysis may not factor in the latest price-sensitive company announcements or qualitative material.
If you spot an error that warrants correction, please contact the editor at editorial-team@simplywallst.com. This article by Simply Wall St is general in nature. It does not constitute a recommendation to buy or sell any stock, and does not take account of your objectives, or your financial situation. Simply Wall St has no position in the stocks mentioned. Thank you for reading.
