
 Yahoo Finance
 Should IMI (LON:IMI) Be Disappointed With Their 84% Profit?
These days it's easy to simply buy an index fund, and your returns should (roughly) match the market. But if you pick the right individual stocks, you could make more than that. To wit, the IMI plc (LON:IMI) share price is 84% higher than it was a year ago, much better than the market return of around 21% (not including dividends) in the same period. If it can keep that out-performance up over the long term, investors will do very well! And shareholders have also done well over the long term, with an increase of 41% in the last three years.
See our latest analysis for IMI
While the efficient markets hypothesis continues to be taught by some, it has been proven that markets are over-reactive dynamic systems, and investors are not always rational. One imperfect but simple way to consider how the market perception of a company has shifted is to compare the change in the earnings per share (EPS) with the share price movement.
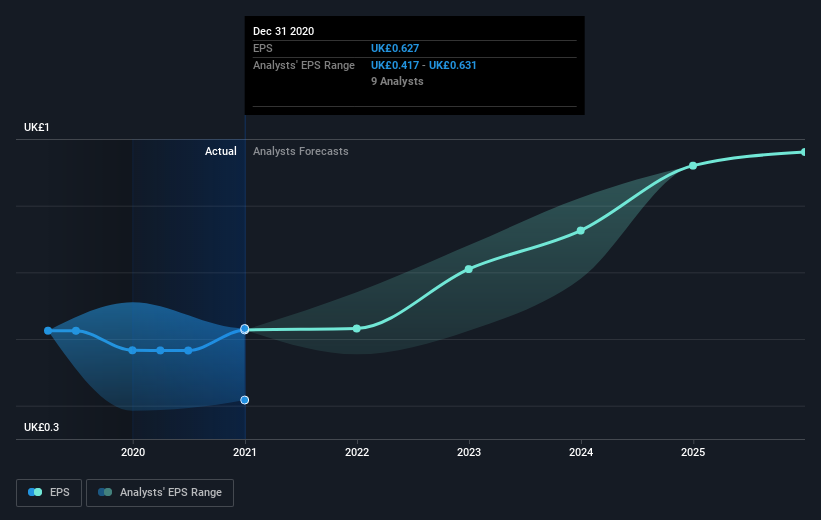
IMI was able to grow EPS by 11% in the last twelve months. The share price gain of 84% certainly outpaced the EPS growth. This indicates that the market is now more optimistic about the stock.
You can see how EPS has changed over time in the image below (click on the chart to see the exact values).
We know that IMI has improved its bottom line lately, but is it going to grow revenue? If you're interested, you could check this free report showing consensus revenue forecasts.
What About Dividends?
It is important to consider the total shareholder return, as well as the share price return, for any given stock. The TSR is a return calculation that accounts for the value of cash dividends (assuming that any dividend received was reinvested) and the calculated value of any discounted capital raisings and spin-offs. So for companies that pay a generous dividend, the TSR is often a lot higher than the share price return. In the case of IMI, it has a TSR of 93% for the last year. That exceeds its share price return that we previously mentioned. This is largely a result of its dividend payments!
A Different Perspective
It's nice to see that IMI shareholders have received a total shareholder return of 93% over the last year. Of course, that includes the dividend. That gain is better than the annual TSR over five years, which is 15%. Therefore it seems like sentiment around the company has been positive lately. Someone with an optimistic perspective could view the recent improvement in TSR as indicating that the business itself is getting better with time. It's always interesting to track share price performance over the longer term. But to understand IMI better, we need to consider many other factors. Consider risks, for instance. Every company has them, and we've spotted 3 warning signs for IMI you should know about.
But note: IMI may not be the best stock to buy. So take a peek at this free list of interesting companies with past earnings growth (and further growth forecast).
Please note, the market returns quoted in this article reflect the market weighted average returns of stocks that currently trade on GB exchanges.
This article by Simply Wall St is general in nature. It does not constitute a recommendation to buy or sell any stock, and does not take account of your objectives, or your financial situation. We aim to bring you long-term focused analysis driven by fundamental data. Note that our analysis may not factor in the latest price-sensitive company announcements or qualitative material. Simply Wall St has no position in any stocks mentioned.
Have feedback on this article? Concerned about the content? Get in touch with us directly. Alternatively, email editorial-team (at) simplywallst.com.
