
 Yahoo Finance
 Is IMI plc (LON:IMI) A Financially Sound Company?

Investors are always looking for growth in small-cap stocks like IMI plc (LON:IMI), with a market cap of UK£2.8b. However, an important fact which most ignore is: how financially healthy is the business? Assessing first and foremost the financial health is vital, as mismanagement of capital can lead to bankruptcies, which occur at a higher rate for small-caps. The following basic checks can help you get a picture of the company's balance sheet strength. However, these checks don't give you a full picture, so I suggest you dig deeper yourself into IMI here.
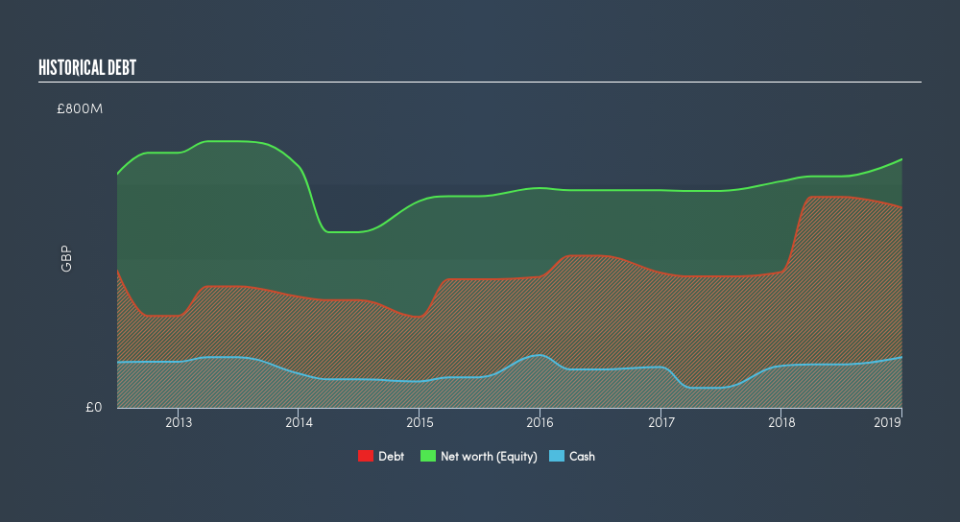
IMI’s Debt (And Cash Flows)
Over the past year, IMI has ramped up its debt from UK£364m to UK£537m – this includes long-term debt. With this growth in debt, the current cash and short-term investment levels stands at UK£136m to keep the business going. On top of this, IMI has produced cash from operations of UK£207m in the last twelve months, leading to an operating cash to total debt ratio of 39%, indicating that IMI’s operating cash is sufficient to cover its debt.
Can IMI pay its short-term liabilities?
At the current liabilities level of UK£631m, the company has been able to meet these obligations given the level of current assets of UK£864m, with a current ratio of 1.37x. The current ratio is the number you get when you divide current assets by current liabilities. For Machinery companies, this ratio is within a sensible range as there's enough of a cash buffer without holding too much capital in low return investments.
Is IMI’s debt level acceptable?
With debt reaching 81% of equity, IMI may be thought of as relatively highly levered. This is a bit unusual for a small-cap stock, since they generally have a harder time borrowing than large more established companies. We can test if IMI’s debt levels are sustainable by measuring interest payments against earnings of a company. Ideally, earnings before interest and tax (EBIT) should cover net interest by at least three times. For IMI, the ratio of 20.53x suggests that interest is comfortably covered, which means that debtors may be willing to loan the company more money, giving IMI ample headroom to grow its debt facilities.
Next Steps:
Although IMI’s debt level is towards the higher end of the spectrum, its cash flow coverage seems adequate to meet obligations which means its debt is being efficiently utilised. Since there is also no concerns around IMI's liquidity needs, this may be its optimal capital structure for the time being. I admit this is a fairly basic analysis for IMI's financial health. Other important fundamentals need to be considered alongside. You should continue to research IMI to get a better picture of the small-cap by looking at:
Future Outlook: What are well-informed industry analysts predicting for IMI’s future growth? Take a look at our free research report of analyst consensus for IMI’s outlook.
Valuation: What is IMI worth today? Is the stock undervalued, even when its growth outlook is factored into its intrinsic value? The intrinsic value infographic in our free research report helps visualize whether IMI is currently mispriced by the market.
Other High-Performing Stocks: Are there other stocks that provide better prospects with proven track records? Explore our free list of these great stocks here.
We aim to bring you long-term focused research analysis driven by fundamental data. Note that our analysis may not factor in the latest price-sensitive company announcements or qualitative material.
If you spot an error that warrants correction, please contact the editor at editorial-team@simplywallst.com. This article by Simply Wall St is general in nature. It does not constitute a recommendation to buy or sell any stock, and does not take account of your objectives, or your financial situation. Simply Wall St has no position in the stocks mentioned. Thank you for reading.
