
 Yahoo Finance
 Some Immsi (BIT:IMS) Shareholders Have Copped A Big 52% Share Price Drop

Statistically speaking, long term investing is a profitable endeavour. But unfortunately, some companies simply don't succeed. For example, after five long years the Immsi S.p.A. (BIT:IMS) share price is a whole 52% lower. That is extremely sub-optimal, to say the least. And some of the more recent buyers are probably worried, too, with the stock falling 38% in the last year. Shareholders have had an even rougher run lately, with the share price down 45% in the last 90 days. However, one could argue that the price has been influenced by the general market, which is down 35% in the same timeframe.
View our latest analysis for Immsi
To paraphrase Benjamin Graham: Over the short term the market is a voting machine, but over the long term it's a weighing machine. One flawed but reasonable way to assess how sentiment around a company has changed is to compare the earnings per share (EPS) with the share price.
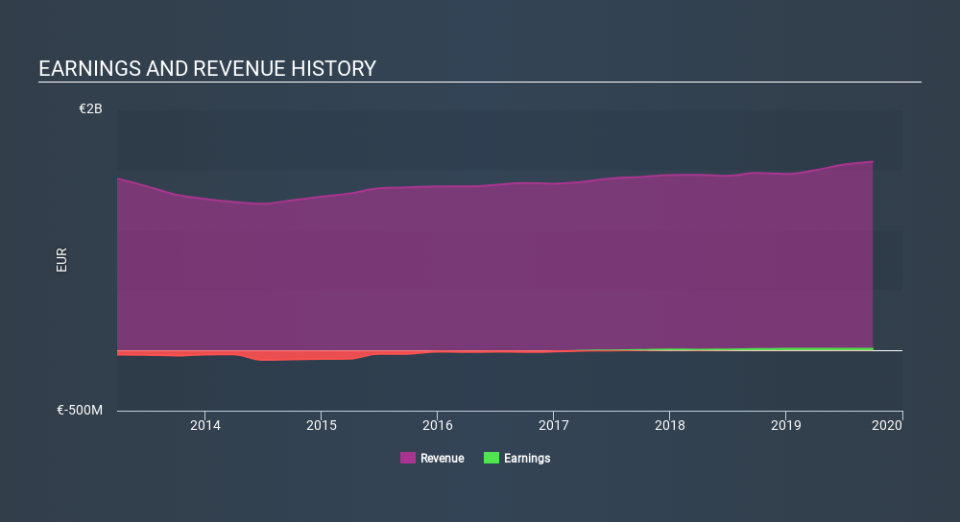
Immsi became profitable within the last five years. That would generally be considered a positive, so we are surprised to see the share price is down. Other metrics may better explain the share price move.
In contrast to the share price, revenue has actually increased by 3.7% a year in the five year period. A more detailed examination of the revenue and earnings may or may not explain why the share price languishes; there could be an opportunity.
You can see how earnings and revenue have changed over time in the image below (click on the chart to see the exact values).
This free interactive report on Immsi's balance sheet strength is a great place to start, if you want to investigate the stock further.
A Different Perspective
We regret to report that Immsi shareholders are down 38% for the year. Unfortunately, that's worse than the broader market decline of 28%. Having said that, it's inevitable that some stocks will be oversold in a falling market. The key is to keep your eyes on the fundamental developments. Regrettably, last year's performance caps off a bad run, with the shareholders facing a total loss of 13% per year over five years. Generally speaking long term share price weakness can be a bad sign, though contrarian investors might want to research the stock in hope of a turnaround. I find it very interesting to look at share price over the long term as a proxy for business performance. But to truly gain insight, we need to consider other information, too. For example, we've discovered 2 warning signs for Immsi (1 shouldn't be ignored!) that you should be aware of before investing here.
We will like Immsi better if we see some big insider buys. While we wait, check out this free list of growing companies with considerable, recent, insider buying.
Please note, the market returns quoted in this article reflect the market weighted average returns of stocks that currently trade on IT exchanges.
If you spot an error that warrants correction, please contact the editor at editorial-team@simplywallst.com. This article by Simply Wall St is general in nature. It does not constitute a recommendation to buy or sell any stock, and does not take account of your objectives, or your financial situation. Simply Wall St has no position in the stocks mentioned.
We aim to bring you long-term focused research analysis driven by fundamental data. Note that our analysis may not factor in the latest price-sensitive company announcements or qualitative material. Thank you for reading.
