
 Yahoo Finance
 Imperial Brands (LON:IMB) Is Looking To Continue Growing Its Returns On Capital
Did you know there are some financial metrics that can provide clues of a potential multi-bagger? Firstly, we'd want to identify a growing return on capital employed (ROCE) and then alongside that, an ever-increasing base of capital employed. Ultimately, this demonstrates that it's a business that is reinvesting profits at increasing rates of return. With that in mind, we've noticed some promising trends at Imperial Brands (LON:IMB) so let's look a bit deeper.
Understanding Return On Capital Employed (ROCE)
If you haven't worked with ROCE before, it measures the 'return' (pre-tax profit) a company generates from capital employed in its business. Analysts use this formula to calculate it for Imperial Brands:
Return on Capital Employed = Earnings Before Interest and Tax (EBIT) ÷ (Total Assets - Current Liabilities)
0.18 = UK£3.2b ÷ (UK£29b - UK£12b) (Based on the trailing twelve months to September 2023).
So, Imperial Brands has an ROCE of 18%. On its own, that's a standard return, however it's much better than the 14% generated by the Tobacco industry.
See our latest analysis for Imperial Brands
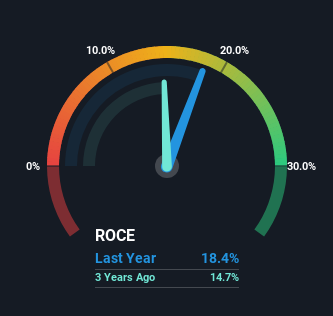
Above you can see how the current ROCE for Imperial Brands compares to its prior returns on capital, but there's only so much you can tell from the past. If you'd like to see what analysts are forecasting going forward, you should check out our free analyst report for Imperial Brands .
The Trend Of ROCE
Imperial Brands is showing promise given that its ROCE is trending up and to the right. Looking at the data, we can see that even though capital employed in the business has remained relatively flat, the ROCE generated has risen by 40% over the last five years. So our take on this is that the business has increased efficiencies to generate these higher returns, all the while not needing to make any additional investments. On that front, things are looking good so it's worth exploring what management has said about growth plans going forward.
On a side note, Imperial Brands' current liabilities are still rather high at 40% of total assets. This effectively means that suppliers (or short-term creditors) are funding a large portion of the business, so just be aware that this can introduce some elements of risk. Ideally we'd like to see this reduce as that would mean fewer obligations bearing risks.
The Bottom Line On Imperial Brands' ROCE
As discussed above, Imperial Brands appears to be getting more proficient at generating returns since capital employed has remained flat but earnings (before interest and tax) are up. Investors may not be impressed by the favorable underlying trends yet because over the last five years the stock has only returned 21% to shareholders. So with that in mind, we think the stock deserves further research.
If you want to continue researching Imperial Brands, you might be interested to know about the 3 warning signs that our analysis has discovered.
While Imperial Brands may not currently earn the highest returns, we've compiled a list of companies that currently earn more than 25% return on equity. Check out this free list here.
Have feedback on this article? Concerned about the content? Get in touch with us directly. Alternatively, email editorial-team (at) simplywallst.com.
This article by Simply Wall St is general in nature. We provide commentary based on historical data and analyst forecasts only using an unbiased methodology and our articles are not intended to be financial advice. It does not constitute a recommendation to buy or sell any stock, and does not take account of your objectives, or your financial situation. We aim to bring you long-term focused analysis driven by fundamental data. Note that our analysis may not factor in the latest price-sensitive company announcements or qualitative material. Simply Wall St has no position in any stocks mentioned.
