
 Yahoo Finance
 Should You Be Impressed By Brixmor Property Group Inc.'s (NYSE:BRX) ROE?
Many investors are still learning about the various metrics that can be useful when analysing a stock. This article is for those who would like to learn about Return On Equity (ROE). To keep the lesson grounded in practicality, we'll use ROE to better understand Brixmor Property Group Inc. (NYSE:BRX).
Return on equity or ROE is an important factor to be considered by a shareholder because it tells them how effectively their capital is being reinvested. Put another way, it reveals the company's success at turning shareholder investments into profits.
See our latest analysis for Brixmor Property Group
How Is ROE Calculated?
The formula for return on equity is:
Return on Equity = Net Profit (from continuing operations) ÷ Shareholders' Equity
So, based on the above formula, the ROE for Brixmor Property Group is:
11% = US$297m ÷ US$2.8b (Based on the trailing twelve months to March 2022).
The 'return' is the yearly profit. So, this means that for every $1 of its shareholder's investments, the company generates a profit of $0.11.
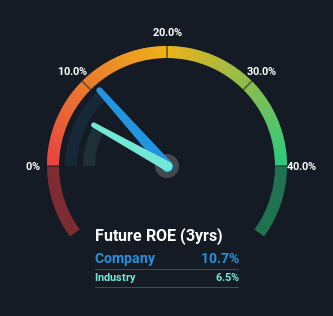
Does Brixmor Property Group Have A Good Return On Equity?
Arguably the easiest way to assess company's ROE is to compare it with the average in its industry. The limitation of this approach is that some companies are quite different from others, even within the same industry classification. Pleasingly, Brixmor Property Group has a superior ROE than the average (6.5%) in the REITs industry.
That is a good sign. With that said, a high ROE doesn't always indicate high profitability. Especially when a firm uses high levels of debt to finance its debt which may boost its ROE but the high leverage puts the company at risk. To know the 3 risks we have identified for Brixmor Property Group visit our risks dashboard for free.
Why You Should Consider Debt When Looking At ROE
Most companies need money -- from somewhere -- to grow their profits. That cash can come from issuing shares, retained earnings, or debt. In the case of the first and second options, the ROE will reflect this use of cash, for growth. In the latter case, the debt required for growth will boost returns, but will not impact the shareholders' equity. That will make the ROE look better than if no debt was used.
Brixmor Property Group's Debt And Its 11% ROE
Brixmor Property Group does use a high amount of debt to increase returns. It has a debt to equity ratio of 1.81. With a fairly low ROE, and significant use of debt, it's hard to get excited about this business at the moment. Investors should think carefully about how a company might perform if it was unable to borrow so easily, because credit markets do change over time.
Summary
Return on equity is one way we can compare its business quality of different companies. Companies that can achieve high returns on equity without too much debt are generally of good quality. All else being equal, a higher ROE is better.
Having said that, while ROE is a useful indicator of business quality, you'll have to look at a whole range of factors to determine the right price to buy a stock. Profit growth rates, versus the expectations reflected in the price of the stock, are a particularly important to consider. So you might want to check this FREE visualization of analyst forecasts for the company.
Of course, you might find a fantastic investment by looking elsewhere. So take a peek at this free list of interesting companies.
Have feedback on this article? Concerned about the content? Get in touch with us directly. Alternatively, email editorial-team (at) simplywallst.com.
This article by Simply Wall St is general in nature. We provide commentary based on historical data and analyst forecasts only using an unbiased methodology and our articles are not intended to be financial advice. It does not constitute a recommendation to buy or sell any stock, and does not take account of your objectives, or your financial situation. We aim to bring you long-term focused analysis driven by fundamental data. Note that our analysis may not factor in the latest price-sensitive company announcements or qualitative material. Simply Wall St has no position in any stocks mentioned.
Join A Paid User Research Session
You’ll receive a US$30 Amazon Gift card for 1 hour of your time while helping us build better investing tools for the individual investors like yourself. Sign up here
