
 Yahoo Finance
 Improved Earnings Required Before A-Mark Precious Metals, Inc. (NASDAQ:AMRK) Stock's 25% Jump Looks Justified
A-Mark Precious Metals, Inc. (NASDAQ:AMRK) shareholders would be excited to see that the share price has had a great month, posting a 25% gain and recovering from prior weakness. Looking back a bit further, it's encouraging to see the stock is up 68% in the last year.
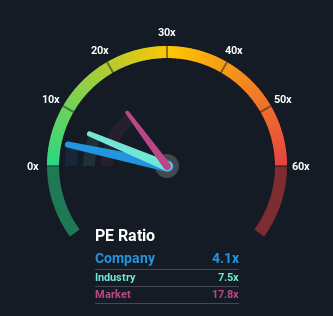
Even after such a large jump in price, given close to half the companies in the United States have price-to-earnings ratios (or "P/E's") above 18x, you may still consider A-Mark Precious Metals as a highly attractive investment with its 4.1x P/E ratio. However, the P/E might be quite low for a reason and it requires further investigation to determine if it's justified.
With earnings growth that's superior to most other companies of late, A-Mark Precious Metals has been doing relatively well. One possibility is that the P/E is low because investors think this strong earnings performance might be less impressive moving forward. If you like the company, you'd be hoping this isn't the case so that you could potentially pick up some stock while it's out of favour.
See our latest analysis for A-Mark Precious Metals
Want the full picture on analyst estimates for the company? Then our free report on A-Mark Precious Metals will help you uncover what's on the horizon.
Does Growth Match The Low P/E?
A-Mark Precious Metals' P/E ratio would be typical for a company that's expected to deliver very poor growth or even falling earnings, and importantly, perform much worse than the market.
Retrospectively, the last year delivered an exceptional 341% gain to the company's bottom line. Although, its longer-term performance hasn't been as strong with three-year EPS growth being relatively non-existent overall. So it appears to us that the company has had a mixed result in terms of growing earnings over that time.
Shifting to the future, estimates from the twin analysts covering the company suggest earnings growth is heading into negative territory, declining 32% per year over the next three years. With the market predicted to deliver 12% growth each year, that's a disappointing outcome.
With this information, we are not surprised that A-Mark Precious Metals is trading at a P/E lower than the market. Nonetheless, there's no guarantee the P/E has reached a floor yet with earnings going in reverse. Even just maintaining these prices could be difficult to achieve as the weak outlook is weighing down the shares.
The Bottom Line On A-Mark Precious Metals' P/E
Even after such a strong price move, A-Mark Precious Metals' P/E still trails the rest of the market significantly. It's argued the price-to-earnings ratio is an inferior measure of value within certain industries, but it can be a powerful business sentiment indicator.
We've established that A-Mark Precious Metals maintains its low P/E on the weakness of its forecast for sliding earnings, as expected. At this stage investors feel the potential for an improvement in earnings isn't great enough to justify a higher P/E ratio. Unless these conditions improve, they will continue to form a barrier for the share price around these levels.
Having said that, be aware A-Mark Precious Metals is showing 5 warning signs in our investment analysis, and 4 of those shouldn't be ignored.
If you're unsure about the strength of A-Mark Precious Metals' business, why not explore our interactive list of stocks with solid business fundamentals for some other companies you may have missed.
This article by Simply Wall St is general in nature. We provide commentary based on historical data and analyst forecasts only using an unbiased methodology and our articles are not intended to be financial advice. It does not constitute a recommendation to buy or sell any stock, and does not take account of your objectives, or your financial situation. We aim to bring you long-term focused analysis driven by fundamental data. Note that our analysis may not factor in the latest price-sensitive company announcements or qualitative material. Simply Wall St has no position in any stocks mentioned.
Have feedback on this article? Concerned about the content? Get in touch with us directly. Alternatively, email editorial-team (at) simplywallst.com.
