
 Yahoo Finance
 Indus Gas (LON:INDI) investors are sitting on a loss of 74% if they invested five years ago
Some stocks are best avoided. It hits us in the gut when we see fellow investors suffer a loss. Anyone who held Indus Gas Limited (LON:INDI) for five years would be nursing their metaphorical wounds since the share price dropped 74% in that time. And some of the more recent buyers are probably worried, too, with the stock falling 67% in the last year. The falls have accelerated recently, with the share price down 14% in the last three months.
Now let's have a look at the company's fundamentals, and see if the long term shareholder return has matched the performance of the underlying business.
Check out our latest analysis for Indus Gas
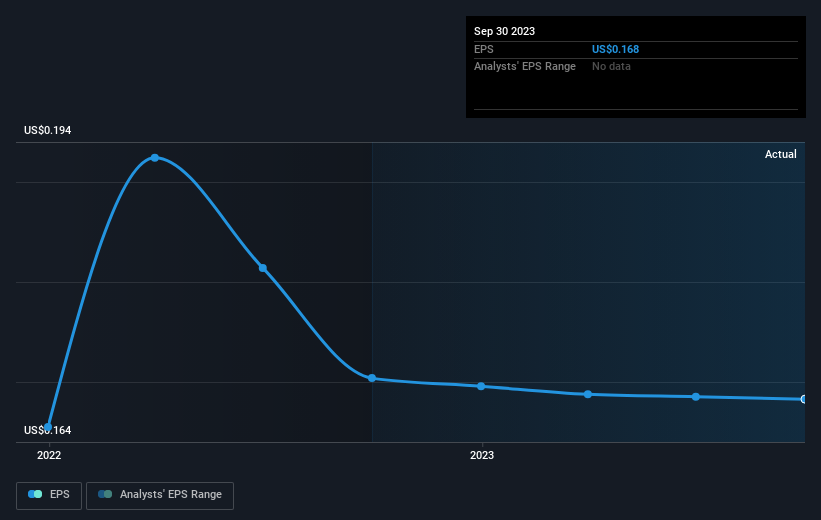
To paraphrase Benjamin Graham: Over the short term the market is a voting machine, but over the long term it's a weighing machine. One flawed but reasonable way to assess how sentiment around a company has changed is to compare the earnings per share (EPS) with the share price.
During the five years over which the share price declined, Indus Gas' earnings per share (EPS) dropped by 2.9% each year. Readers should note that the share price has fallen faster than the EPS, at a rate of 24% per year, over the period. This implies that the market is more cautious about the business these days. The low P/E ratio of 5.65 further reflects this reticence.
You can see below how EPS has changed over time (discover the exact values by clicking on the image).
Dive deeper into Indus Gas' key metrics by checking this interactive graph of Indus Gas's earnings, revenue and cash flow.
A Different Perspective
While the broader market gained around 8.4% in the last year, Indus Gas shareholders lost 67%. However, keep in mind that even the best stocks will sometimes underperform the market over a twelve month period. Regrettably, last year's performance caps off a bad run, with the shareholders facing a total loss of 12% per year over five years. Generally speaking long term share price weakness can be a bad sign, though contrarian investors might want to research the stock in hope of a turnaround. I find it very interesting to look at share price over the long term as a proxy for business performance. But to truly gain insight, we need to consider other information, too. Take risks, for example - Indus Gas has 2 warning signs we think you should be aware of.
Of course Indus Gas may not be the best stock to buy. So you may wish to see this free collection of growth stocks.
Please note, the market returns quoted in this article reflect the market weighted average returns of stocks that currently trade on British exchanges.
Have feedback on this article? Concerned about the content? Get in touch with us directly. Alternatively, email editorial-team (at) simplywallst.com.
This article by Simply Wall St is general in nature. We provide commentary based on historical data and analyst forecasts only using an unbiased methodology and our articles are not intended to be financial advice. It does not constitute a recommendation to buy or sell any stock, and does not take account of your objectives, or your financial situation. We aim to bring you long-term focused analysis driven by fundamental data. Note that our analysis may not factor in the latest price-sensitive company announcements or qualitative material. Simply Wall St has no position in any stocks mentioned.
