
 Yahoo Finance
 Is Industria de Diseño Textil, S.A.'s (BME:ITX) High P/E Ratio A Problem For Investors?

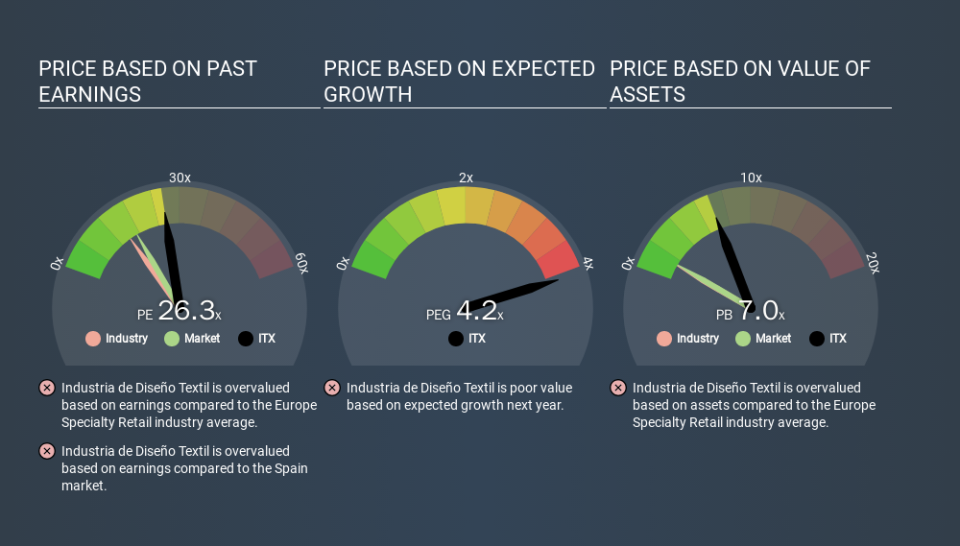
The goal of this article is to teach you how to use price to earnings ratios (P/E ratios). We'll show how you can use Industria de Diseño Textil, S.A.'s (BME:ITX) P/E ratio to inform your assessment of the investment opportunity. Industria de Diseño Textil has a price to earnings ratio of 26.27, based on the last twelve months. That means that at current prices, buyers pay €26.27 for every €1 in trailing yearly profits.
See our latest analysis for Industria de Diseño Textil
How Do I Calculate Industria de Diseño Textil's Price To Earnings Ratio?
The formula for price to earnings is:
Price to Earnings Ratio = Share Price ÷ Earnings per Share (EPS)
Or for Industria de Diseño Textil:
P/E of 26.27 = €31.43 ÷ €1.20 (Based on the year to October 2019.)
Is A High P/E Ratio Good?
A higher P/E ratio means that buyers have to pay a higher price for each €1 the company has earned over the last year. That isn't necessarily good or bad, but a high P/E implies relatively high expectations of what a company can achieve in the future.
How Does Industria de Diseño Textil's P/E Ratio Compare To Its Peers?
The P/E ratio indicates whether the market has higher or lower expectations of a company. The image below shows that Industria de Diseño Textil has a higher P/E than the average (14.9) P/E for companies in the specialty retail industry.
That means that the market expects Industria de Diseño Textil will outperform other companies in its industry. Shareholders are clearly optimistic, but the future is always uncertain. So further research is always essential. I often monitor director buying and selling.
How Growth Rates Impact P/E Ratios
Generally speaking the rate of earnings growth has a profound impact on a company's P/E multiple. Earnings growth means that in the future the 'E' will be higher. That means even if the current P/E is high, it will reduce over time if the share price stays flat. And as that P/E ratio drops, the company will look cheap, unless its share price increases.
Industria de Diseño Textil saw earnings per share improve by -7.5% last year. And it has bolstered its earnings per share by 9.3% per year over the last five years.
Don't Forget: The P/E Does Not Account For Debt or Bank Deposits
Don't forget that the P/E ratio considers market capitalization. That means it doesn't take debt or cash into account. The exact same company would hypothetically deserve a higher P/E ratio if it had a strong balance sheet, than if it had a weak one with lots of debt, because a cashed up company can spend on growth.
Such expenditure might be good or bad, in the long term, but the point here is that the balance sheet is not reflected by this ratio.
Industria de Diseño Textil's Balance Sheet
Industria de Diseño Textil has net cash of €7.7b. That should lead to a higher P/E than if it did have debt, because its strong balance sheets gives it more options.
The Verdict On Industria de Diseño Textil's P/E Ratio
Industria de Diseño Textil's P/E is 26.3 which is above average (17.1) in its market. EPS was up modestly better over the last twelve months. And the net cash position provides the company with multiple options. The high P/E suggests the market thinks further growth will come.
Investors should be looking to buy stocks that the market is wrong about. People often underestimate remarkable growth -- so investors can make money when fast growth is not fully appreciated. So this free report on the analyst consensus forecasts could help you make a master move on this stock.
Of course, you might find a fantastic investment by looking at a few good candidates. So take a peek at this free list of companies with modest (or no) debt, trading on a P/E below 20.
If you spot an error that warrants correction, please contact the editor at editorial-team@simplywallst.com. This article by Simply Wall St is general in nature. It does not constitute a recommendation to buy or sell any stock, and does not take account of your objectives, or your financial situation. Simply Wall St has no position in the stocks mentioned.
We aim to bring you long-term focused research analysis driven by fundamental data. Note that our analysis may not factor in the latest price-sensitive company announcements or qualitative material. Thank you for reading.
