Here’s What The Inflation Rate Was the Year You Were Born

Inflation rates affect how far your money goes toward purchases, how much your savings are worth and how much you pay to borrow funds. Although the Federal Reserve has set a 2% yearly target, inflation rates have changed over the decades based on factors such as labor issues, price or demand changes, money supply fluctuations and economic crises. You might find it interesting to see how they’ve fluctuated and compare them to the present.
Check Out: What Is the Median Household Income for the Upper Middle Class in 2024?
Read Next: 9 Things You Must Do To Grow Your Wealth in 2024
To create this list of historical inflation rates, GOBankingRates used consumer price index data provided by the Federal Reserve Bank of Minneapolis and the U.S. Bureau of Labor Statistics. In addition to including the yearly inflation rates from 1930 to the present, we highlighted some trends or economic factors marking the decades. Find your birth year following to see what inflation was like.
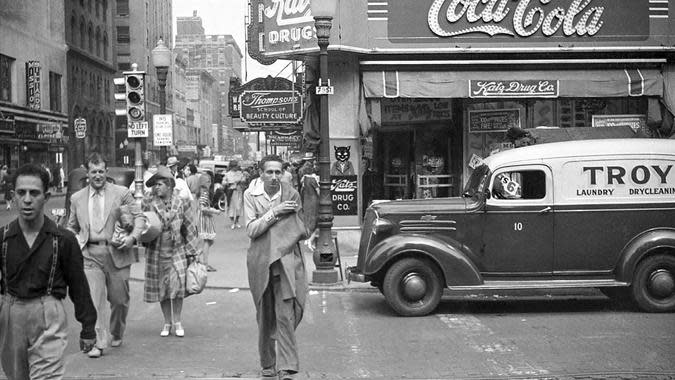
1930-1939
Known for the Great Depression and major financial collapse, this decade often featured negative inflation rates, which were the most severe early on.
1930: -2.7%
1931: -8.9%
1932: -10.3%
1933: -5.2%
1934: 3.5%
1935: 2.6%
1936: 1%
1937: 3.7%
1938: -2%
1939: -1.3%
Related Info: I’m an Economist — Here Are My Predictions for Inflation If Biden Wins Again
Trending Now: Here’s the Living Wage a Single Person Needs To Live Comfortably in Arizona
Earning passive income doesn't need to be difficult. You can start this week.
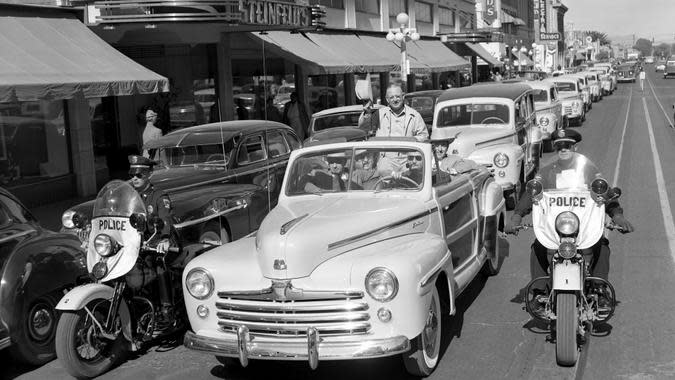
1940-1949
Inflation rates took a turn during the 1940s and reached high points during and just after World War II. After short recessions in 1945 and 1948 through 1949, the decade ended with deflation.
1940: 0.7%
1941: 5.1%
1942: 10.9%
1943: 6%
1944: 1.6%
1945: 2.3%
1946: 8.5%
1947: 14.4%
1948: 7.7%
1949: -1%
It’s Just Politics: 5 Changes That Could Be Coming for the Middle Class If Biden Is Reelected in 2024
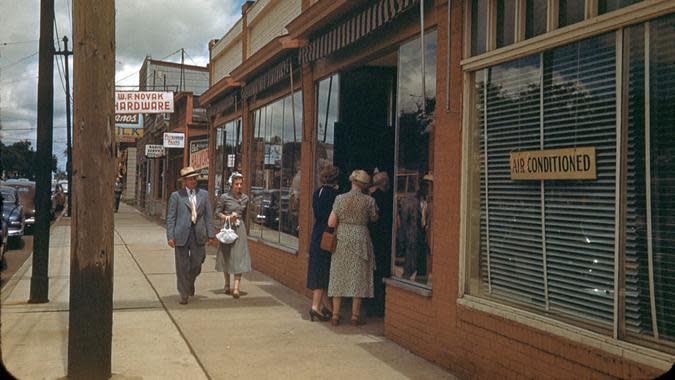
1950-1959
While inflation rates peaked in 1951, they remained below 2% for most of the decade, but a brief recession from 1957 to 1958 caused mildly elevated rates.
1950: 1.1%
1951: 7.9%
1952: 2.3%
1953: 0.8%
1954: 0.3%
1955: -0.3%
1956: 1.5%
1957: 3.3%
1958: 2.7%
1959: 1.08%
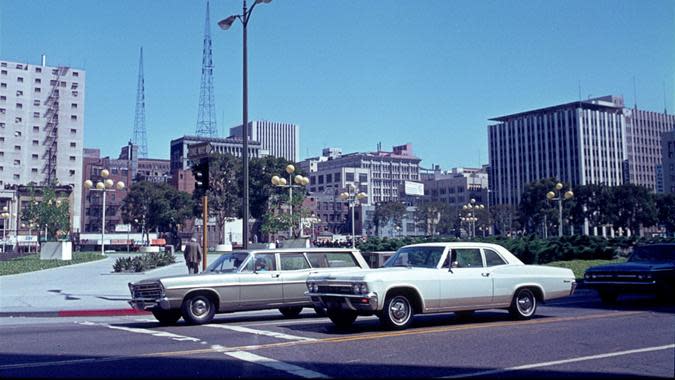
1960-1969
While the 1960s started with a short recession, inflation rates remained low through 1965 before they began rising and the decade ended with another recession.
1960: 1.5%
1961: 1.1%
1962: 1.2%
1963: 1.2%
1964: 1.3%
1965: 1.6%
1966: 3%
1967: 2.8%
1968: 4.3%
1969: 5.5%

1970-1979
Due to factors such as the oil crisis, federal monetary decisions, and stock market crashes, inflation rates stayed significantly above the 2% target during the 1970s and peaked as the decade closed.
1970: 5.8%
1971: 4.3%
1972: 3.3%
1973: 6.2%
1974: 11.1%
1975: 9.1%
1976: 5.7%
1977: 6.5%
1978: 7.6%
1979: 11.3%
1980-1989
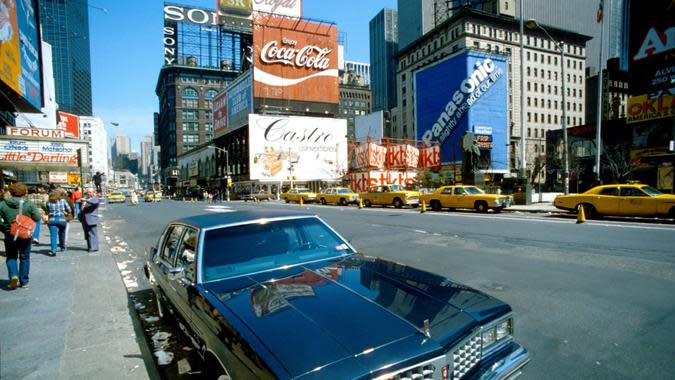
As the 1980s started with a recession, the inflation rate hit its highest point since 1947. While falling and rising multiple times over the decade, inflation rates mostly stayed above 3%.
1980: 13.5%
1981: 10.3%
1982: 6.1%
1983: 3.2%
1984: 4.3%
1985: 3.5%
1986: 1.9%
1987: 3.7%
1988: 4.1%
1989: 4.8%
Check This: 6 Reasons the Poor Stay Poor and Middle Class Doesn’t Become Wealthy
1990-1999
The 1990s began with elevated inflation rates due to financial crashes and the Persian Gulf War, though rates would fall below 3% from 1994 to the end of the decade.
1990: 5.4%
1991: 4.2%
1992: 3%
1993: 3%
1994: 2.6%
1995: 2.8%
1996: 2.9%
1997: 2.3%
1998: 1.6%
1999: 2.2%
2000-2009
While not marked by extreme inflation, the 2000s included the early 2001 recession and later the more impactful 2008-2009 Great Recession, which led to the decade’s peak inflation rate followed by mild deflation.
2000: 3.4%
2001: 2.8%
2002: 1.6%
2003: 2.3%
2004: 2.7%
2005: 3.4%
2006: 3.2%
2007: 2.9%
2008: 3.8%
2009: -0.4%
2010-2019
As the country’s economy recovered from the big financial crisis, this decade’s inflation rates were usually near or below the 2% target, reaching their highest in 2011 and lowest in 2015.
2010: 1.6%
2011: 3.2%
2012: 2.1%
2013: 1.5%
2014: 1.6%
2015: 0.1%
2016: 1.3%
2017: 2.1%
2018: 2.4%
2019: 1.8%
Happiness Check: The 50 Happiest States in America and How Much It Costs to Live There
2020-Present
While inflation has since fallen, the COVID-19 pandemic shocked the economy and contributed to a 2022 8% inflation rate that was the highest since the 1980s.
2020: 1.2%
2021: 4.7%
2022: 8%
2023: 4.1%
2024: 3.3% (as of May 2024)
More From GOBankingRates
7 Reasons A Financial Advisor Could Boost Your Savings in 2024
4 Best International Cities to Buy a House in the Next 5 Years, According to Real Estate Experts
17 Walmart Items Retirees Should Stock Up on Before Winter Hits
This article originally appeared on GOBankingRates.com: Here’s What The Inflation Rate Was the Year You Were Born