
 Yahoo Finance
 Is Informa plc (LON:INF) A Financially Sound Company?

Want to participate in a short research study? Help shape the future of investing tools and receive a $20 prize!
Informa plc (LON:INF), a large-cap worth UK£9.0b, comes to mind for investors seeking a strong and reliable stock investment. Big corporations are much sought after by risk-averse investors who find diversified revenue streams and strong capital returns attractive. However, the key to extending previous success is in the health of the company’s financials. This article will examine Informa’s financial liquidity and debt levels to get an idea of whether the company can deal with cyclical downturns and maintain funds to accommodate strategic spending for future growth. Note that this commentary is very high-level and solely focused on financial health, so I suggest you dig deeper yourself into INF here.
View our latest analysis for Informa
How much cash does INF generate through its operations?
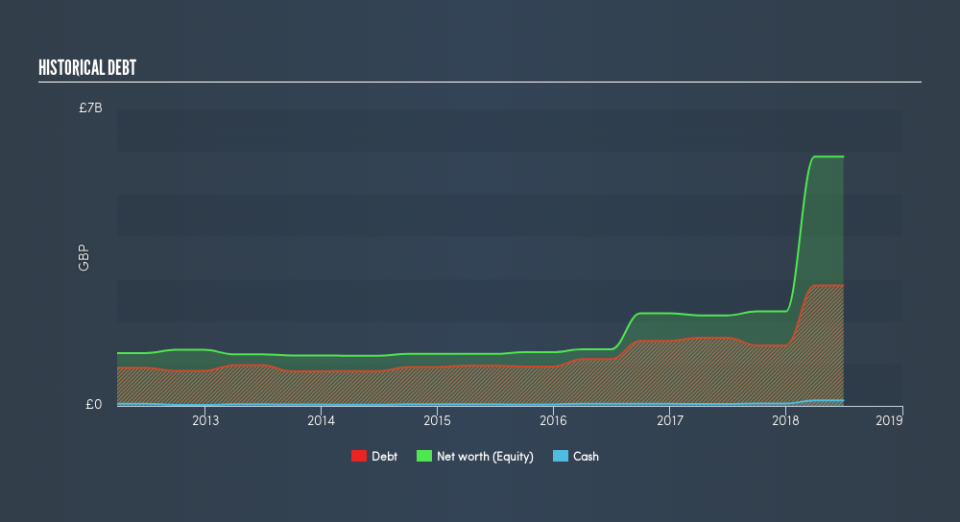
INF has built up its total debt levels in the last twelve months, from UK£1.6b to UK£2.8b , which accounts for long term debt. With this rise in debt, the current cash and short-term investment levels stands at UK£132m , ready to deploy into the business. Additionally, INF has produced UK£429m in operating cash flow in the last twelve months, resulting in an operating cash to total debt ratio of 15%, signalling that INF’s debt is not appropriately covered by operating cash. This ratio can also be a sign of operational efficiency as an alternative to return on assets. In INF’s case, it is able to generate 0.15x cash from its debt capital.
Can INF pay its short-term liabilities?
With current liabilities at UK£1.9b, the company may not be able to easily meet these obligations given the level of current assets of UK£772m, with a current ratio of 0.42x.
Can INF service its debt comfortably?
With a debt-to-equity ratio of 48%, INF can be considered as an above-average leveraged company. This is common amongst large-cap companies because debt can often be a less expensive alternative to equity due to tax deductibility of interest payments. Since large-caps are seen as safer than their smaller constituents, they tend to enjoy lower cost of capital. We can check to see whether INF is able to meet its debt obligations by looking at the net interest coverage ratio. Preferably, earnings before interest and tax (EBIT) should be at least three times as large as net interest. For INF, the ratio of 6.64x suggests that interest is appropriately covered. Large-cap investments like INF are often believed to be a safe investment due to their ability to pump out ample earnings multiple times its interest payments.
Next Steps:
INF’s cash flow coverage indicates it could improve its operating efficiency in order to meet demand for debt repayments should unforeseen events arise. Furthermore, its low liquidity raises concerns over whether current asset management practices are properly implemented for the large-cap. Keep in mind I haven’t considered other factors such as how INF has been performing in the past. I suggest you continue to research Informa to get a better picture of the stock by looking at:
Future Outlook: What are well-informed industry analysts predicting for INF’s future growth? Take a look at our free research report of analyst consensus for INF’s outlook.
Valuation: What is INF worth today? Is the stock undervalued, even when its growth outlook is factored into its intrinsic value? The intrinsic value infographic in our free research report helps visualize whether INF is currently mispriced by the market.
Other High-Performing Stocks: Are there other stocks that provide better prospects with proven track records? Explore our free list of these great stocks here.
We aim to bring you long-term focused research analysis driven by fundamental data. Note that our analysis may not factor in the latest price-sensitive company announcements or qualitative material.
If you spot an error that warrants correction, please contact the editor at editorial-team@simplywallst.com. This article by Simply Wall St is general in nature. It does not constitute a recommendation to buy or sell any stock, and does not take account of your objectives, or your financial situation. Simply Wall St has no position in the stocks mentioned. Thank you for reading.
