
 Yahoo Finance
 Should Ingenico Group - GCS (EPA:ING) Be Part Of Your Dividend Portfolio?

Want to participate in a short research study? Help shape the future of investing tools and you could win a $250 gift card!
Today we'll take a closer look at Ingenico Group - GCS (EPA:ING) from a dividend investor's perspective. Owning a strong business and reinvesting the dividends is widely seen as an attractive way of growing your wealth. If you are hoping to live on the income from dividends, it's important to be a lot more stringent with your investments than the average punter.
With a 1.5% yield and a nine-year payment history, investors probably think Ingenico Group - GCS looks like a reliable dividend stock. While the yield may not look too great, the relatively long payment history is interesting. The company also bought back stock equivalent to around 2.0% of market capitalisation this year. Some simple analysis can reduce the risk of holding Ingenico Group - GCS for its dividend, and we'll focus on the most important aspects below.
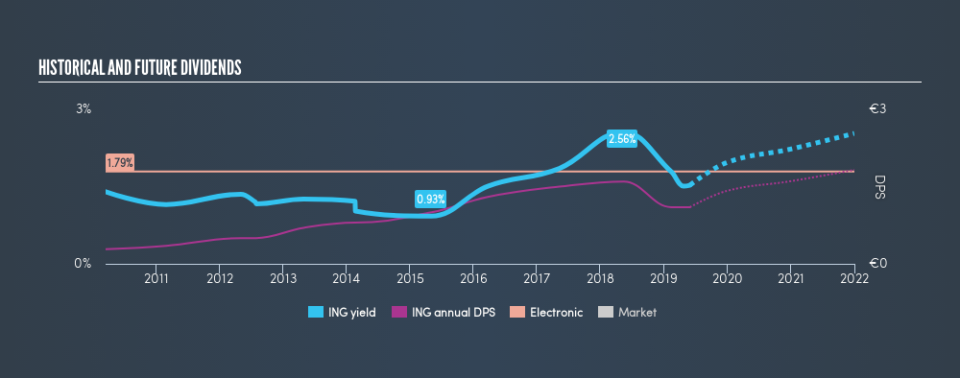
Explore this interactive chart for our latest analysis on Ingenico Group - GCS!
Payout ratios
Dividends are usually paid out of company earnings. If a company is paying more than it earns, then the dividend might become unsustainable - hardly an ideal situation. So we need to be form a view on if a company's dividend is sustainable, relative to its net profit after tax. In the last year, Ingenico Group - GCS paid out 36% of its profit as dividends. A medium payout ratio strikes a good balance between paying dividends, and keeping enough back to invest in the business. Plus, there is room to increase the payout ratio over time.
We also measure dividends paid against a company's levered free cash flow, to see if enough cash was generated to cover the dividend. Ingenico Group - GCS's cash payout ratio last year was 22%, which is quite low and suggests that the dividend was thoroughly covered by cash flow. It's encouraging to see that the dividend is covered by both profit and cash flow. This generally suggests the dividend is sustainable, as long as earnings don't drop precipitously.
Is Ingenico Group - GCS's Balance Sheet Risky?
As Ingenico Group - GCS has a meaningful amount of debt, we need to check its balance sheet to see if the company might have debt risks. A quick way to check a company's financial situation uses these two ratios: net debt divided by EBITDA (earnings before interest, tax, depreciation and amortisation), and net interest cover. Net debt to EBITDA is a measure of a company's total debt. Net interest cover measures the ability to meet interest payments on debt. Essentially we check that a) a company does not have too much debt, and b) that it can afford to pay the interest. Ingenico Group - GCS is carrying net debt of 3.32 times its EBITDA, which is getting towards the upper limit of our comfort range on a dividend stock that the investor hopes will endure a wide range of economic circumstances.
Net interest cover can be calculated by dividing earnings before interest and tax (EBIT) by the company's net interest expense. Ingenico Group - GCS has EBIT of 10.91 times its interest expense, which we think is adequate.
We update our data on Ingenico Group - GCS every 24 hours, so you can always get our latest analysis of its financial health, here.
Dividend Volatility
One of the major risks of relying on dividend income, is the potential for a company to struggle financially and cut its dividend. Not only is your income cut, but the value of your investment declines as well - nasty. Looking at the last decade of data, we can see that Ingenico Group - GCS paid its first dividend at least nine years ago. Although it has been paying a dividend for several years now, the dividend has been cut at least once by more than 20%, and we're cautious about the consistency of its dividend across a full economic cycle. During the past nine-year period, the first annual payment was €0.29 in 2010, compared to €1.10 last year. This works out to be a compound annual growth rate (CAGR) of approximately 16% a year over that time. The dividends haven't grown at precisely 16% every year, but this is a useful way to average out the historical rate of growth.
It's not great to see that the payment has been cut in the past. We're generally more wary of companies that have cut their dividend before, as they tend to perform worse in an economic downturn.
Dividend Growth Potential
Given that the dividend has been cut in the past, we need to check if earnings are growing and if that might lead to stronger dividends in the future. Earnings have grown at around 7.0% a year for the past five years, which is better than seeing them shrink! Earnings per share have been growing at a credible rate. What's more, the payout ratio is reasonable and provides some protection to the dividend, or even the potential to increase it.
Conclusion
Dividend investors should always want to know if a) a company's dividends are affordable, b) if there is a track record of consistent payments, and c) if the dividend is capable of growing. Firstly, we like that Ingenico Group - GCS has low and conservative payout ratios. Unfortunately, earnings growth has also been mediocre, and the company has cut its dividend at least once in the past. Ingenico Group - GCS has a number of positive attributes, but it falls slightly short of our (admittedly high) standards. Were there evidence of a strong moat or an attractive valuation, it could still be well worth a look.
Companies that are growing earnings tend to be the best dividend stocks over the long term. See what the 15 analysts we track are forecasting for Ingenico Group - GCS for free with public analyst estimates for the company.
If you are a dividend investor, you might also want to look at our curated list of dividend stocks yielding above 3%.
We aim to bring you long-term focused research analysis driven by fundamental data. Note that our analysis may not factor in the latest price-sensitive company announcements or qualitative material.
If you spot an error that warrants correction, please contact the editor at editorial-team@simplywallst.com. This article by Simply Wall St is general in nature. It does not constitute a recommendation to buy or sell any stock, and does not take account of your objectives, or your financial situation. Simply Wall St has no position in the stocks mentioned. Thank you for reading.
